

Prosopis invasions in the Northern Cape (van den Berg 2010) suggests they reduce
the MAR by about 9 million m
3 /year, primarily in the Orange River catchment
(Le Maitre et al. 2013). Projections of the invasions in the remaining natural
vegetation in the mapped catchments, suggest that the impacts will increase
(Le Maitre unpublished data). At an spread rate of 5%/year and density increase of
1%/year, the total reduction in MAR would reach Æ2.59 billion m
3 /year (5.2% of
MAR) in 25 years (i.e. 2032) (Fig. 15.3). At 10%/year, they would reach Æ3.15
billion m
3 /year by 2032 (6.3% of MAR). The increases in reductions are spread all
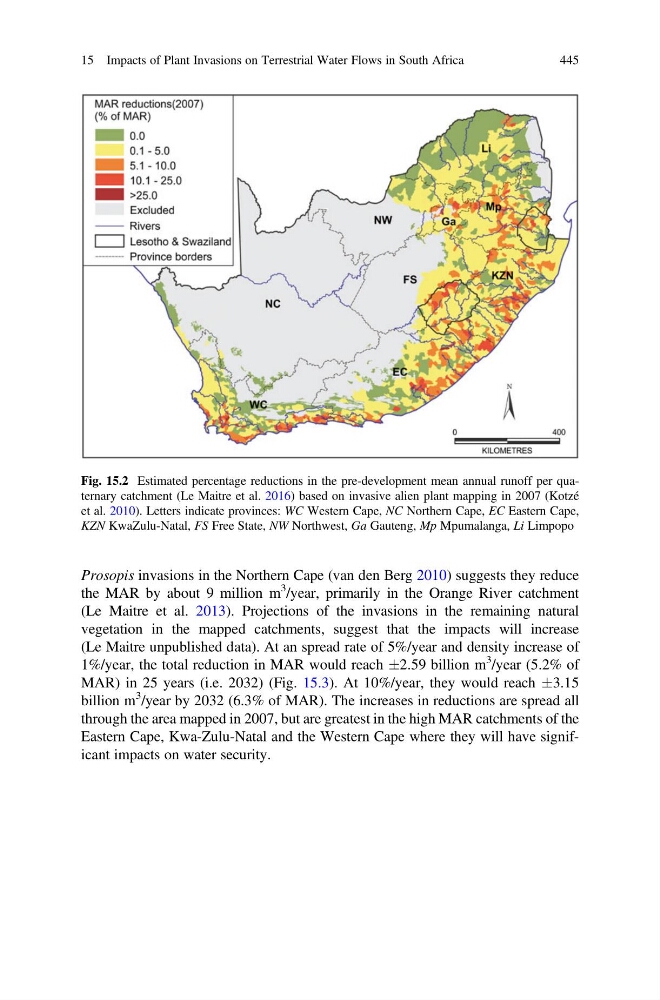
through the area mapped in 2007, but are greatest in the high MAR catchments of the
Eastern Cape, Kwa-Zulu-Natal and the Western Cape where they will have significant impacts on water security.
Fig. 15.2 Estimated percentage reductions in the pre-development mean annual runoff per quaternary catchment (Le Maitre et al. 2016) based on invasive alien plant mapping in 2007 (Kotzé
et al. 2010). Letters indicate provinces: WC Western Cape, NC Northern Cape, EC Eastern Cape,
KZN KwaZulu-Natal, FS Free State, NW Northwest, Ga Gauteng, Mp Mpumalanga, Li Limpopo
15 Impacts of Plant Invasions on Terrestrial Water Flows in South Africa
445
the MAR by about 9 million m
3 /year, primarily in the Orange River catchment
(Le Maitre et al. 2013). Projections of the invasions in the remaining natural
vegetation in the mapped catchments, suggest that the impacts will increase
(Le Maitre unpublished data). At an spread rate of 5%/year and density increase of
1%/year, the total reduction in MAR would reach Æ2.59 billion m
3 /year (5.2% of
MAR) in 25 years (i.e. 2032) (Fig. 15.3). At 10%/year, they would reach Æ3.15
billion m
3 /year by 2032 (6.3% of MAR). The increases in reductions are spread all
through the area mapped in 2007, but are greatest in the high MAR catchments of the
Eastern Cape, Kwa-Zulu-Natal and the Western Cape where they will have significant impacts on water security.
Fig. 15.2 Estimated percentage reductions in the pre-development mean annual runoff per quaternary catchment (Le Maitre et al. 2016) based on invasive alien plant mapping in 2007 (Kotzé
et al. 2010). Letters indicate provinces: WC Western Cape, NC Northern Cape, EC Eastern Cape,
KZN KwaZulu-Natal, FS Free State, NW Northwest, Ga Gauteng, Mp Mpumalanga, Li Limpopo
15 Impacts of Plant Invasions on Terrestrial Water Flows in South Africa
445