

8
7
9
6
2
1
4
3
5
°0’E
°0’E
°0’E
°0’E
°0’E
°0’S
°0’S
°0’S
W.M.A (Act 36/1998)
1. Limpopo
2. Olifants
3. Inkomati-Usuthu
4. Pongola-Mzimkulu
5. Vaal
6. Orange
7. MzimvubuTsitsikamma
8. Breede-Gouritz
9. Berg-Olifants
RIVERS &
WATER
MANAGEMENT
AREAS
0
2 5 0
5 0 0
125
Km
L
°0’E
°0’E
°0’E
°0’E
°0’E
°0’S
°0’S
°0’S
LANDCOVER
Cultivated
Grassland
Indigenous Forest
Low shrubland
Mines
Plantation
Thicket
Urban
Water
Wetlands
Woodland
Bare
Fynbos shrubland
0
2 5 0
5 0 0
125
Km
L
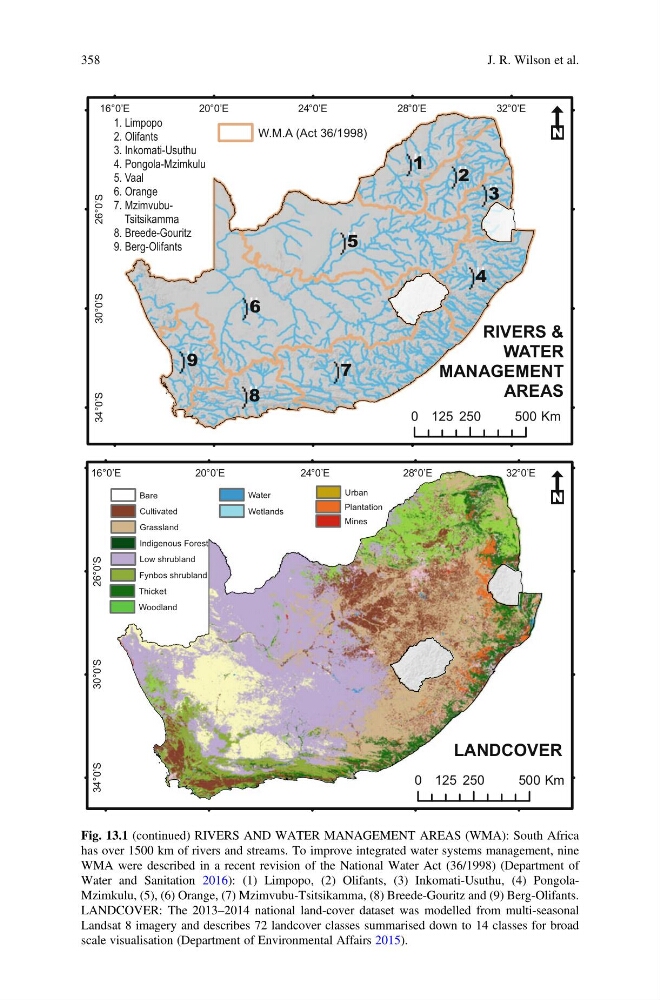
Fig. 13.1 (continued) RIVERS AND WATER MANAGEMENT AREAS (WMA): South Africa
has over 1500 km of rivers and streams. To improve integrated water systems management, nine
WMA were described in a recent revision of the National Water Act (36/1998) (Department of
Water and Sanitation 2016): (1) Limpopo, (2) Olifants, (3) Inkomati-Usuthu, (4) PongolaMzimkulu, (5), (6) Orange, (7) Mzimvubu-Tsitsikamma, (8) Breede-Gouritz and (9) Berg-Olifants.
LANDCOVER: The 2013–2014 national land-cover dataset was modelled from multi-seasonal
Landsat 8 imagery and describes 72 landcover classes summarised down to 14 classes for broad
scale visualisation (Department of Environmental Affairs 2015).
358
J. R. Wilson et al.
7
9
6
2
1
4
3
5
°0’E
°0’E
°0’E
°0’E
°0’E
°0’S
°0’S
°0’S
W.M.A (Act 36/1998)
1. Limpopo
2. Olifants
3. Inkomati-Usuthu
4. Pongola-Mzimkulu
5. Vaal
6. Orange
7. MzimvubuTsitsikamma
8. Breede-Gouritz
9. Berg-Olifants
RIVERS &
WATER
MANAGEMENT
AREAS
0
2 5 0
5 0 0
125
Km
L
°0’E
°0’E
°0’E
°0’E
°0’E
°0’S
°0’S
°0’S
LANDCOVER
Cultivated
Grassland
Indigenous Forest
Low shrubland
Mines
Plantation
Thicket
Urban
Water
Wetlands
Woodland
Bare
Fynbos shrubland
0
2 5 0
5 0 0
125
Km
L
Fig. 13.1 (continued) RIVERS AND WATER MANAGEMENT AREAS (WMA): South Africa
has over 1500 km of rivers and streams. To improve integrated water systems management, nine
WMA were described in a recent revision of the National Water Act (36/1998) (Department of
Water and Sanitation 2016): (1) Limpopo, (2) Olifants, (3) Inkomati-Usuthu, (4) PongolaMzimkulu, (5), (6) Orange, (7) Mzimvubu-Tsitsikamma, (8) Breede-Gouritz and (9) Berg-Olifants.
LANDCOVER: The 2013–2014 national land-cover dataset was modelled from multi-seasonal
Landsat 8 imagery and describes 72 landcover classes summarised down to 14 classes for broad
scale visualisation (Department of Environmental Affairs 2015).
358
J. R. Wilson et al.