

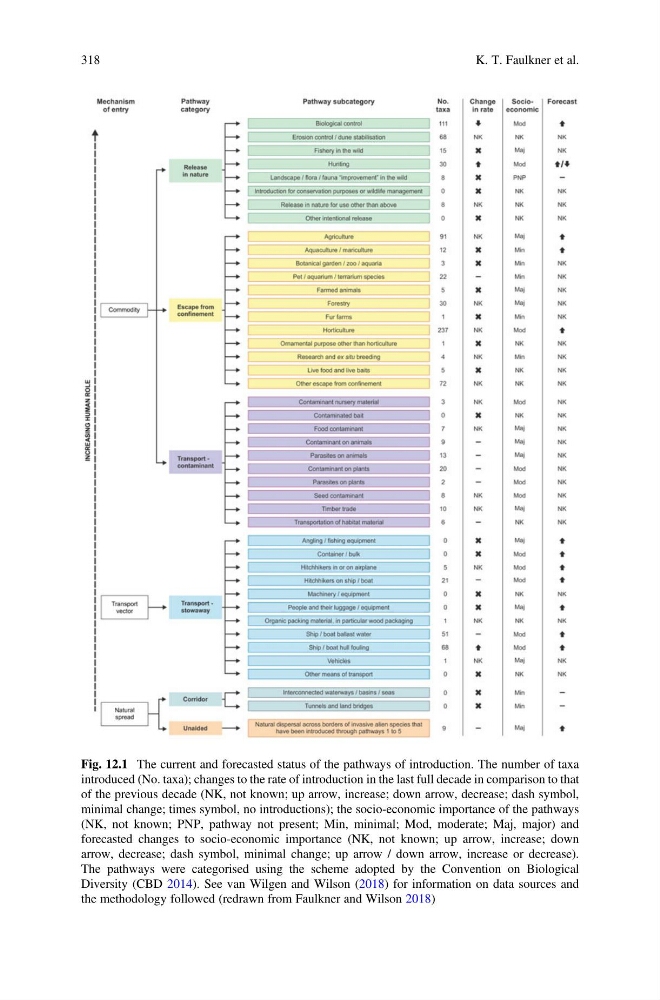
Fig. 12.1 The current and forecasted status of the pathways of introduction. The number of taxa
introduced (No. taxa); changes to the rate of introduction in the last full decade in comparison to that
of the previous decade (NK, not known; up arrow, increase; down arrow, decrease; dash symbol,
minimal change; times symbol, no introductions); the socio-economic importance of the pathways
(NK, not known; PNP, pathway not present; Min, minimal; Mod, moderate; Maj, major) and
forecasted changes to socio-economic importance (NK, not known; up arrow, increase; down
arrow, decrease; dash symbol, minimal change; up arrow / down arrow, increase or decrease).
The pathways were categorised using the scheme adopted by the Convention on Biological
Diversity (CBD 2014). See van Wilgen and Wilson (2018) for information on data sources and
the methodology followed (redrawn from Faulkner and Wilson 2018)
318
K. T. Faulkner et al.
introduced (No. taxa); changes to the rate of introduction in the last full decade in comparison to that
of the previous decade (NK, not known; up arrow, increase; down arrow, decrease; dash symbol,
minimal change; times symbol, no introductions); the socio-economic importance of the pathways
(NK, not known; PNP, pathway not present; Min, minimal; Mod, moderate; Maj, major) and
forecasted changes to socio-economic importance (NK, not known; up arrow, increase; down
arrow, decrease; dash symbol, minimal change; up arrow / down arrow, increase or decrease).
The pathways were categorised using the scheme adopted by the Convention on Biological
Diversity (CBD 2014). See van Wilgen and Wilson (2018) for information on data sources and
the methodology followed (redrawn from Faulkner and Wilson 2018)
318
K. T. Faulkner et al.