

138
6 Equilibrium Structures from Spectroscopy
where the I m are calculated from the structure as if the molecule were a rigid rotor.
When a structure is calculated with this approximation, it gives the r
(1)
m structure
(Watson et al. 1999). This method was called m because it is mass-dependent as
shown by (6.15) and “1” because one extra parameter per axis is added. It does not
require more parameters than the r s -fit (or r Iε ) method and, often, gives better results.
There are, however, two cases where this method fails: (i) when a hydrogen atom
is substituted by deuterium; (ii) when the substituted atom is close to the center of
mass.
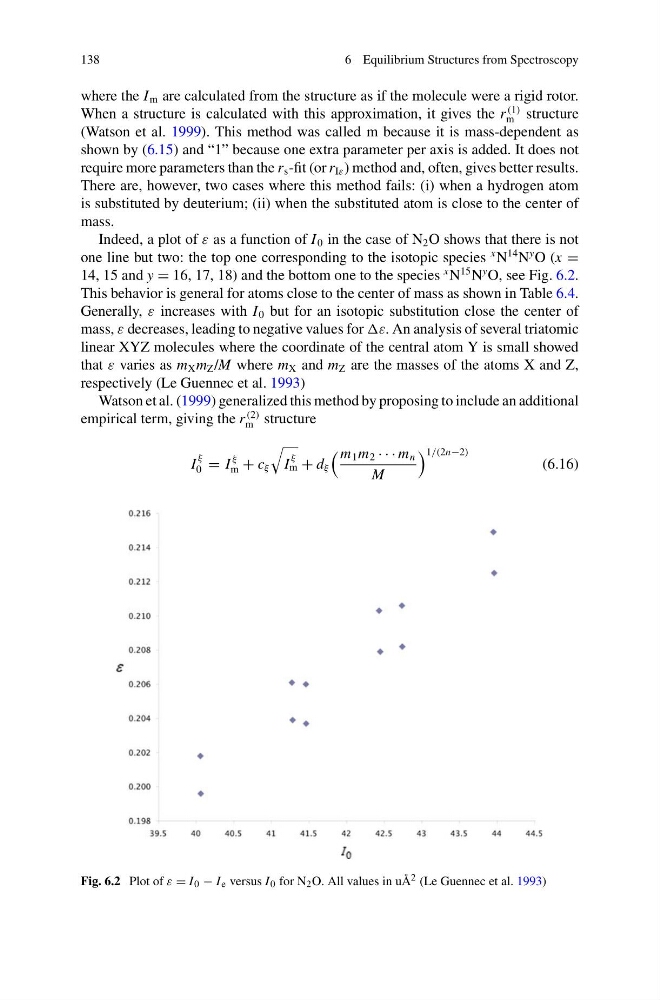
Indeed, a plot of ε as a function of I 0 in the case of N 2 O shows that there is not
one line but two: the top one corresponding to the isotopic species
x N
14 N
y O (x =
14, 15 and y = 16, 17, 18) and the bottom one to the species
x N
15 N
y O, see Fig. 6.2.
This behavior is general for atoms close to the center of mass as shown in Table 6.4.
Generally, ε increases with I 0 but for an isotopic substitution close the center of
mass, ε decreases, leading to negative values for ε. An analysis of several triatomic
linear XYZ molecules where the coordinate of the central atom Y is small showed
that ε varies as m X m Z /M where m X and m Z are the masses of the atoms X and Z,
respectively (Le Guennec et al. 1993)
Watson et al. (1999) generalized this method by proposing to include an additional
empirical term, giving the r
(2)
m structure
I
ξ
0 = I
ξ
m + c ξ
I
ξ
m + d ξ
m 1 m 2 · · · m n
M
1/(2n−2)
(6.16)
Fig. 6.2 Plot of ε = I 0 − I e versus I 0 for N 2 O. All values in uÅ 2 (Le Guennec et al. 1993)
6 Equilibrium Structures from Spectroscopy
where the I m are calculated from the structure as if the molecule were a rigid rotor.
When a structure is calculated with this approximation, it gives the r
(1)
m structure
(Watson et al. 1999). This method was called m because it is mass-dependent as
shown by (6.15) and “1” because one extra parameter per axis is added. It does not
require more parameters than the r s -fit (or r Iε ) method and, often, gives better results.
There are, however, two cases where this method fails: (i) when a hydrogen atom
is substituted by deuterium; (ii) when the substituted atom is close to the center of
mass.
Indeed, a plot of ε as a function of I 0 in the case of N 2 O shows that there is not
one line but two: the top one corresponding to the isotopic species
x N
14 N
y O (x =
14, 15 and y = 16, 17, 18) and the bottom one to the species
x N
15 N
y O, see Fig. 6.2.
This behavior is general for atoms close to the center of mass as shown in Table 6.4.
Generally, ε increases with I 0 but for an isotopic substitution close the center of
mass, ε decreases, leading to negative values for ε. An analysis of several triatomic
linear XYZ molecules where the coordinate of the central atom Y is small showed
that ε varies as m X m Z /M where m X and m Z are the masses of the atoms X and Z,
respectively (Le Guennec et al. 1993)
Watson et al. (1999) generalized this method by proposing to include an additional
empirical term, giving the r
(2)
m structure
I
ξ
0 = I
ξ
m + c ξ
I
ξ
m + d ξ
m 1 m 2 · · · m n
M
1/(2n−2)
(6.16)
Fig. 6.2 Plot of ε = I 0 − I e versus I 0 for N 2 O. All values in uÅ 2 (Le Guennec et al. 1993)