

4.11 Determination of the Rotational Constants
93
number of normal modes (see Chap. 5). To determine a structure from the rotational
constants, it is essential to use a non-redundant set which may require some expertise
(Mendolicchio et al. 2017). On the other hand, to calculate rotational constants from
the geometry, any convenient set may be used.
Except for very simple molecules, it is difficult to express the moments of inertia
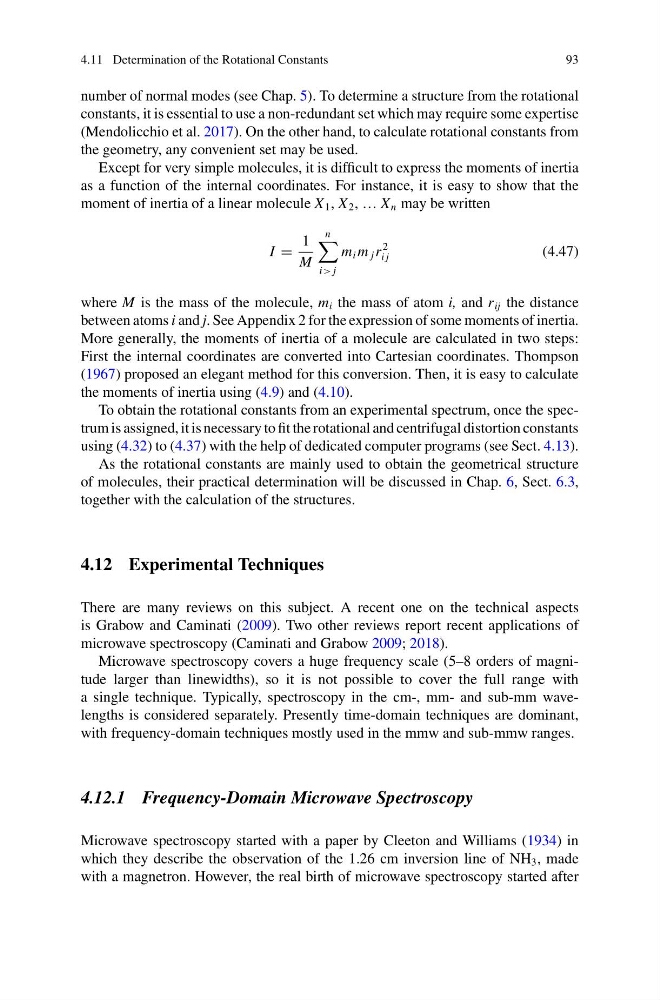
as a function of the internal coordinates. For instance, it is easy to show that the
moment of inertia of a linear molecule X 1 , X 2 , … X n may be written
I =
1
M
n
i> j
m i m j r
2
i j
(4.47)
where M is the mass of the molecule, m i the mass of atom i, and r ij the distance
between atoms i and j. See Appendix 2 for the expression of some moments of inertia.
More generally, the moments of inertia of a molecule are calculated in two steps:
First the internal coordinates are converted into Cartesian coordinates. Thompson
(1967) proposed an elegant method for this conversion. Then, it is easy to calculate
the moments of inertia using (4.9) and (4.10).
To obtain the rotational constants from an experimental spectrum, once the spectrum is assigned, it is necessary to fit the rotational and centrifugal distortion constants
using (4.32) to (4.37) with the help of dedicated computer programs (see Sect. 4.13).
As the rotational constants are mainly used to obtain the geometrical structure
of molecules, their practical determination will be discussed in Chap. 6, Sect. 6.3,
together with the calculation of the structures.
4.12 Experimental Techniques
There are many reviews on this subject. A recent one on the technical aspects
is Grabow and Caminati (2009). Two other reviews report recent applications of
microwave spectroscopy (Caminati and Grabow 2009; 2018).
Microwave spectroscopy covers a huge frequency scale (5–8 orders of magnitude larger than linewidths), so it is not possible to cover the full range with
a single technique. Typically, spectroscopy in the cm-, mm- and sub-mm wavelengths is considered separately. Presently time-domain techniques are dominant,
with frequency-domain techniques mostly used in the mmw and sub-mmw ranges.
4.12.1 Frequency-Domain Microwave Spectroscopy
Microwave spectroscopy started with a paper by Cleeton and Williams (1934) in
which they describe the observation of the 1.26 cm inversion line of NH 3 , made
with a magnetron. However, the real birth of microwave spectroscopy started after
93
number of normal modes (see Chap. 5). To determine a structure from the rotational
constants, it is essential to use a non-redundant set which may require some expertise
(Mendolicchio et al. 2017). On the other hand, to calculate rotational constants from
the geometry, any convenient set may be used.
Except for very simple molecules, it is difficult to express the moments of inertia
as a function of the internal coordinates. For instance, it is easy to show that the
moment of inertia of a linear molecule X 1 , X 2 , … X n may be written
I =
1
M
n
i> j
m i m j r
2
i j
(4.47)
where M is the mass of the molecule, m i the mass of atom i, and r ij the distance
between atoms i and j. See Appendix 2 for the expression of some moments of inertia.
More generally, the moments of inertia of a molecule are calculated in two steps:
First the internal coordinates are converted into Cartesian coordinates. Thompson
(1967) proposed an elegant method for this conversion. Then, it is easy to calculate
the moments of inertia using (4.9) and (4.10).
To obtain the rotational constants from an experimental spectrum, once the spectrum is assigned, it is necessary to fit the rotational and centrifugal distortion constants
using (4.32) to (4.37) with the help of dedicated computer programs (see Sect. 4.13).
As the rotational constants are mainly used to obtain the geometrical structure
of molecules, their practical determination will be discussed in Chap. 6, Sect. 6.3,
together with the calculation of the structures.
4.12 Experimental Techniques
There are many reviews on this subject. A recent one on the technical aspects
is Grabow and Caminati (2009). Two other reviews report recent applications of
microwave spectroscopy (Caminati and Grabow 2009; 2018).
Microwave spectroscopy covers a huge frequency scale (5–8 orders of magnitude larger than linewidths), so it is not possible to cover the full range with
a single technique. Typically, spectroscopy in the cm-, mm- and sub-mm wavelengths is considered separately. Presently time-domain techniques are dominant,
with frequency-domain techniques mostly used in the mmw and sub-mmw ranges.
4.12.1 Frequency-Domain Microwave Spectroscopy
Microwave spectroscopy started with a paper by Cleeton and Williams (1934) in
which they describe the observation of the 1.26 cm inversion line of NH 3 , made
with a magnetron. However, the real birth of microwave spectroscopy started after