

also SIRT1 in addition to SIRT3; those compounds were filtered out in order
to achieve isoform-selectivity. The compound named SDX-437 was observed to
exhibit an IC 50 value of 700 nM for SIRT3, whereas no inhibition was observed
against SIRT1 [158].
Thiobarbiturates were reported to be potent inhibitors for SIRT1, SIRT2, and
SIRT5 and generally less potent toward SIRT3. The most potent thiobarbiturate
inhibitor (compound 52 in Fig. 11) showed IC 50 values of 13 μM and 9 μM for
SIRT1 and SIRT2, respectively [159]. Maurer and coworkers discovered several
thiobarbiturate analogs, which displayed inhibition with IC 50 values in the range
of 3.4–89 μM toward SIRT1, in the range of 3.4–20.3 μM for SIRT2, and in the
range of 2.3–67.3 μM for SIRT5 [80]. Modifications of the basic skeleton of
thiobarbiturate led to the identification of a novel inhibitor scaffold, aurone. Some
aurones showed inhibition toward the deacetylation activity of SIRT1, and the most
potent of the aurones exhibited an IC 50 value of 1.0 μM. Aurones showed also
antiproliferative properties against two breast cancer cell lines (MDA-MB-231 and
MCF7) in vitro [160].
Recently, a set of SIRT1 inhibitors having a 1,4-bispiperazinecarbodithioic acid
methyl ester scaffold (compound 53 in Fig. 11) has been identified. The most potent
compounds displayed IC 50 values in a range of 1–11 μM for SIRT1; no IC 50 values
for other sirtuins were reported. The most potent compound with this scaffold
inhibited SIRT2 at the cellular level and exerted also an antiproliferative effect in
a human gastric cancer cell line MGC-803 [161].
So far, fewer SIRT6 regulators have been detected. In silico screening revealed a
set of compounds which displayed inhibitory activity against SIRT6 at the micromolar level [75]. The most potent compound of the screening hits, 5-(3-(furan-2carboxamido)benzamido)-2-hydroxybenzoic acid (compound 54 in Fig. 11),
exhibited IC 50 values of 89 μM for SIRT6, 1,578 μM for SIRT1, and 751 μM for
SIRT2. A study where human primary pancreatic adenocarcinoma (BxPC-3) cells
were treated with compound 54 resulted in an increased glucose uptake. Other
micromolar SIRT6 inhibitors, quinazolinedione-based derivatives, also increased
glucose uptake, and they also sensitized cancer cells to both gemcitabine and
olaparib [162].
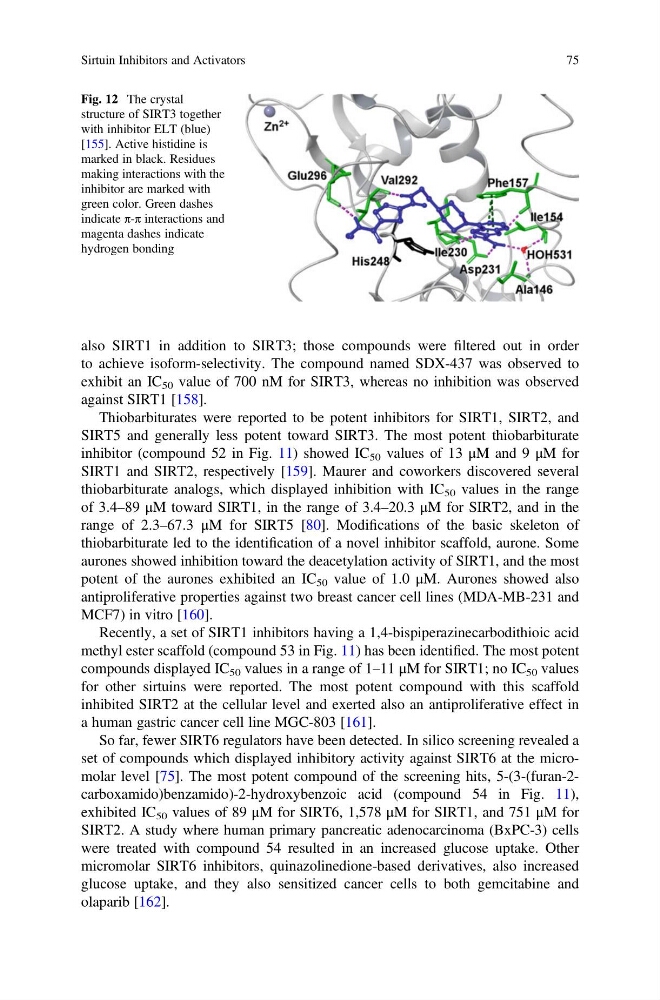
Fig. 12 The crystal
structure of SIRT3 together
with inhibitor ELT (blue)
[155]. Active histidine is
marked in black. Residues
making interactions with the
inhibitor are marked with
green color. Green dashes
indicate π-π interactions and
magenta dashes indicate
hydrogen bonding
Sirtuin Inhibitors and Activators
75
to achieve isoform-selectivity. The compound named SDX-437 was observed to
exhibit an IC 50 value of 700 nM for SIRT3, whereas no inhibition was observed
against SIRT1 [158].
Thiobarbiturates were reported to be potent inhibitors for SIRT1, SIRT2, and
SIRT5 and generally less potent toward SIRT3. The most potent thiobarbiturate
inhibitor (compound 52 in Fig. 11) showed IC 50 values of 13 μM and 9 μM for
SIRT1 and SIRT2, respectively [159]. Maurer and coworkers discovered several
thiobarbiturate analogs, which displayed inhibition with IC 50 values in the range
of 3.4–89 μM toward SIRT1, in the range of 3.4–20.3 μM for SIRT2, and in the
range of 2.3–67.3 μM for SIRT5 [80]. Modifications of the basic skeleton of
thiobarbiturate led to the identification of a novel inhibitor scaffold, aurone. Some
aurones showed inhibition toward the deacetylation activity of SIRT1, and the most
potent of the aurones exhibited an IC 50 value of 1.0 μM. Aurones showed also
antiproliferative properties against two breast cancer cell lines (MDA-MB-231 and
MCF7) in vitro [160].
Recently, a set of SIRT1 inhibitors having a 1,4-bispiperazinecarbodithioic acid
methyl ester scaffold (compound 53 in Fig. 11) has been identified. The most potent
compounds displayed IC 50 values in a range of 1–11 μM for SIRT1; no IC 50 values
for other sirtuins were reported. The most potent compound with this scaffold
inhibited SIRT2 at the cellular level and exerted also an antiproliferative effect in
a human gastric cancer cell line MGC-803 [161].
So far, fewer SIRT6 regulators have been detected. In silico screening revealed a
set of compounds which displayed inhibitory activity against SIRT6 at the micromolar level [75]. The most potent compound of the screening hits, 5-(3-(furan-2carboxamido)benzamido)-2-hydroxybenzoic acid (compound 54 in Fig. 11),
exhibited IC 50 values of 89 μM for SIRT6, 1,578 μM for SIRT1, and 751 μM for
SIRT2. A study where human primary pancreatic adenocarcinoma (BxPC-3) cells
were treated with compound 54 resulted in an increased glucose uptake. Other
micromolar SIRT6 inhibitors, quinazolinedione-based derivatives, also increased
glucose uptake, and they also sensitized cancer cells to both gemcitabine and
olaparib [162].
Fig. 12 The crystal
structure of SIRT3 together
with inhibitor ELT (blue)
[155]. Active histidine is
marked in black. Residues
making interactions with the
inhibitor are marked with
green color. Green dashes
indicate π-π interactions and
magenta dashes indicate
hydrogen bonding
Sirtuin Inhibitors and Activators
75