

a combination of 5mC, 5hmC, 5fC, and 5caC, only a few of them will be
discussed here.
Earlier approaches employed offline analyte enrichment prior to HPLC-ESI-MS/
MS analysis to minimize chemical noise and improve detection sensitivity. Sample
cleanup steps can include offline HPLC [10, 59] or solid-phase extraction [13]. In
one example, DNA digests were subjected to offline HPLC cleanup, followed by
HPLC-MS/MS/MS method on a LTQ linear ion trap [59]. The methodology used
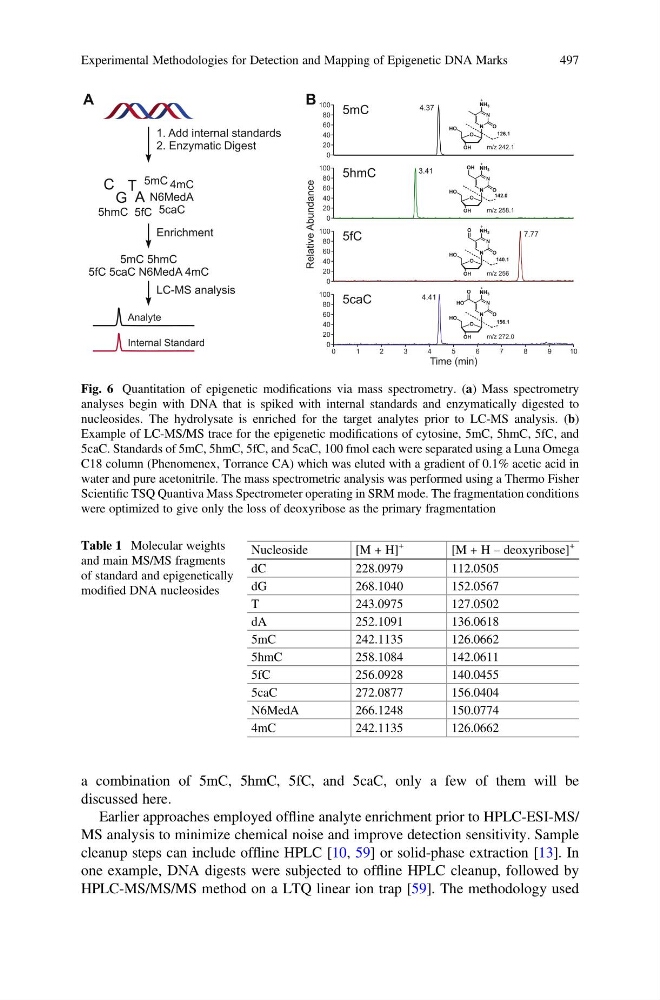
Fig. 6 Quantitation of epigenetic modifications via mass spectrometry. (a) Mass spectrometry
analyses begin with DNA that is spiked with internal standards and enzymatically digested to
nucleosides. The hydrolysate is enriched for the target analytes prior to LC-MS analysis. (b)
Example of LC-MS/MS trace for the epigenetic modifications of cytosine, 5mC, 5hmC, 5fC, and
5caC. Standards of 5mC, 5hmC, 5fC, and 5caC, 100 fmol each were separated using a Luna Omega
C18 column (Phenomenex, Torrance CA) which was eluted with a gradient of 0.1% acetic acid in
water and pure acetonitrile. The mass spectrometric analysis was performed using a Thermo Fisher
Scientific TSQ Quantiva Mass Spectrometer operating in SRM mode. The fragmentation conditions
were optimized to give only the loss of deoxyribose as the primary fragmentation
Table 1 Molecular weights
and main MS/MS fragments
of standard and epigenetically
modified DNA nucleosides
Nucleoside
[M + H]
+
[M + H – deoxyribose]
+
dC
228.0979
112.0505
dG
268.1040
152.0567
T
243.0975
127.0502
dA
252.1091
136.0618
5mC
242.1135
126.0662
5hmC
258.1084
142.0611
5fC
256.0928
140.0455
5caC
272.0877
156.0404
N6MedA
266.1248
150.0774
4mC
242.1135
126.0662
Experimental Methodologies for Detection and Mapping of Epigenetic DNA Marks
497
discussed here.
Earlier approaches employed offline analyte enrichment prior to HPLC-ESI-MS/
MS analysis to minimize chemical noise and improve detection sensitivity. Sample
cleanup steps can include offline HPLC [10, 59] or solid-phase extraction [13]. In
one example, DNA digests were subjected to offline HPLC cleanup, followed by
HPLC-MS/MS/MS method on a LTQ linear ion trap [59]. The methodology used
Fig. 6 Quantitation of epigenetic modifications via mass spectrometry. (a) Mass spectrometry
analyses begin with DNA that is spiked with internal standards and enzymatically digested to
nucleosides. The hydrolysate is enriched for the target analytes prior to LC-MS analysis. (b)
Example of LC-MS/MS trace for the epigenetic modifications of cytosine, 5mC, 5hmC, 5fC, and
5caC. Standards of 5mC, 5hmC, 5fC, and 5caC, 100 fmol each were separated using a Luna Omega
C18 column (Phenomenex, Torrance CA) which was eluted with a gradient of 0.1% acetic acid in
water and pure acetonitrile. The mass spectrometric analysis was performed using a Thermo Fisher
Scientific TSQ Quantiva Mass Spectrometer operating in SRM mode. The fragmentation conditions
were optimized to give only the loss of deoxyribose as the primary fragmentation
Table 1 Molecular weights
and main MS/MS fragments
of standard and epigenetically
modified DNA nucleosides
Nucleoside
[M + H]
+
[M + H – deoxyribose]
+
dC
228.0979
112.0505
dG
268.1040
152.0567
T
243.0975
127.0502
dA
252.1091
136.0618
5mC
242.1135
126.0662
5hmC
258.1084
142.0611
5fC
256.0928
140.0455
5caC
272.0877
156.0404
N6MedA
266.1248
150.0774
4mC
242.1135
126.0662
Experimental Methodologies for Detection and Mapping of Epigenetic DNA Marks
497