

Δδ obs ¼ Δδ max Â
K d þ L
½ þ P
½
ð
Þ À
ffiffiffiffiffiffiffiffiffiffiffiffiffiffiffiffiffiffiffiffiffiffiffiffiffiffiffiffiffiffiffiffiffiffiffiffiffiffiffiffiffiffiffiffiffiffiffiffiffiffi
K d þ L
½ þ P
½
ð
Þ
2 À 4 PL
½
q
2 PL
½
ð1Þ
where Δδ max is the maximum change in chemical shift, L is the concentration of
ligand, and P is the concentration of protein. Equation 1 is a variation of Eq. 2, the
general K d equation that accounts for ligand or protein depletion.
PL
½ ¼
K d þ P
½ tot
À
à þ L tot
½
Á À
ffiffiffiffiffiffiffiffiffiffiffiffiffiffiffiffiffiffiffiffiffiffiffiffiffiffiffiffiffiffiffiffiffiffiffiffiffiffiffiffiffiffiffiffiffiffiffiffiffiffiffiffiffiffiffiffiffiffiffiffiffiffiffiffiffiffiffiffiffiffiffi
K d þ
Â
P tot
À
à þ L tot
½
Á 2 À 4 P
½ tot
Ã
L
½ tot
i
r
2
ð2Þ
In Eq. 2, P tot is the total concentration of protein, and L tot is the total concentration
of the ligand.
4.2.2 Two-Dimensional NMR Methods Provide a Detailed Picture
of the Binding Interaction
Two-dimensional protein-observed NMR experiments identify the binding site and
give information on the key amino acids involved in binding interactions. Common
experiments of this type include
1 H15 N- or
1 H13 C-HSQC/HMQC experiments.
1 H15 N-HSQC/HMQC monitors the protein amide backbone, and
1 H13 C-HSQC/
HMQC experiments monitor isotopically labeled protein methyl groups resulting in
a simpler spectrum than
15 N labeling. These experiments can be lengthy, require
large amounts of isotopically labeled protein, and give complicated spectra to
interpret making them not ideal for screening large libraries of ligands. However,
both methods have successfully been used to screen for bromodomain inhibitors. For
example, Hasvold et al. used
1 H13 C-HSQC to screen 18,000 fragments in mixtures
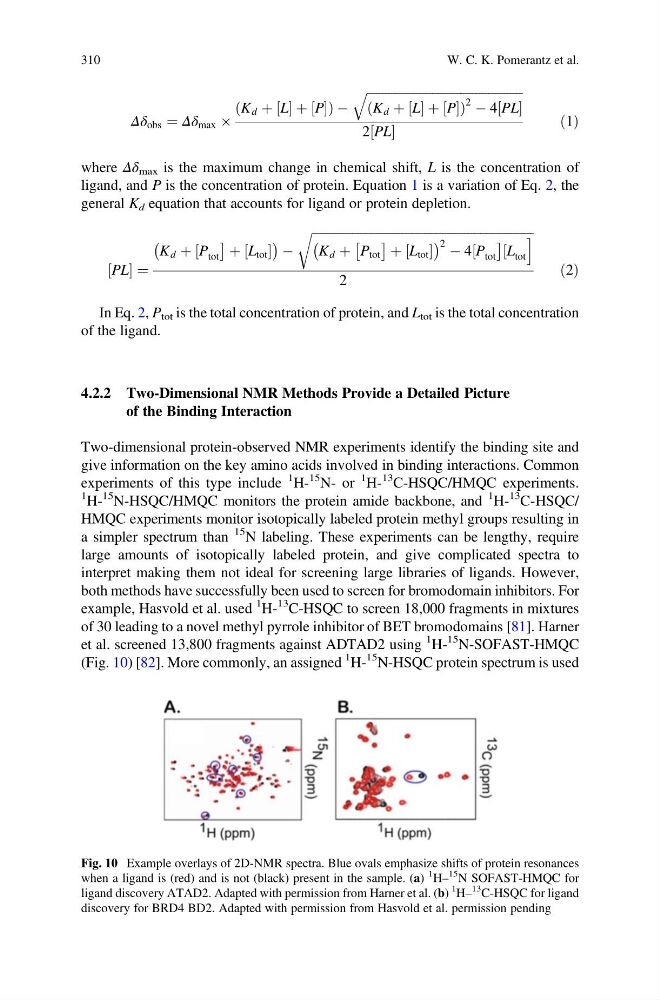
of 30 leading to a novel methyl pyrrole inhibitor of BET bromodomains [81]. Harner
et al. screened 13,800 fragments against ADTAD2 using
1 H15 N-SOFAST-HMQC
(Fig. 10) [82]. More commonly, an assigned
1 H15 N-HSQC protein spectrum is used
Fig. 10 Example overlays of 2D-NMR spectra. Blue ovals emphasize shifts of protein resonances
when a ligand is (red) and is not (black) present in the sample. (a)
1
H–
15 N SOFAST-HMQC for
ligand discovery ATAD2. Adapted with permission from Harner et al. (b)
1
H–
13
C-HSQC for ligand
discovery for BRD4 BD2. Adapted with permission from Hasvold et al. permission pending
310
W. C. K. Pomerantz et al.
K d þ L
½ þ P
½
ð
Þ À
ffiffiffiffiffiffiffiffiffiffiffiffiffiffiffiffiffiffiffiffiffiffiffiffiffiffiffiffiffiffiffiffiffiffiffiffiffiffiffiffiffiffiffiffiffiffiffiffiffiffi
K d þ L
½ þ P
½
ð
Þ
2 À 4 PL
½
q
2 PL
½
ð1Þ
where Δδ max is the maximum change in chemical shift, L is the concentration of
ligand, and P is the concentration of protein. Equation 1 is a variation of Eq. 2, the
general K d equation that accounts for ligand or protein depletion.
PL
½ ¼
K d þ P
½ tot
À
à þ L tot
½
Á À
ffiffiffiffiffiffiffiffiffiffiffiffiffiffiffiffiffiffiffiffiffiffiffiffiffiffiffiffiffiffiffiffiffiffiffiffiffiffiffiffiffiffiffiffiffiffiffiffiffiffiffiffiffiffiffiffiffiffiffiffiffiffiffiffiffiffiffiffiffiffiffi
K d þ
Â
P tot
À
à þ L tot
½
Á 2 À 4 P
½ tot
Ã
L
½ tot
i
r
2
ð2Þ
In Eq. 2, P tot is the total concentration of protein, and L tot is the total concentration
of the ligand.
4.2.2 Two-Dimensional NMR Methods Provide a Detailed Picture
of the Binding Interaction
Two-dimensional protein-observed NMR experiments identify the binding site and
give information on the key amino acids involved in binding interactions. Common
experiments of this type include
1 H15 N- or
1 H13 C-HSQC/HMQC experiments.
1 H15 N-HSQC/HMQC monitors the protein amide backbone, and
1 H13 C-HSQC/
HMQC experiments monitor isotopically labeled protein methyl groups resulting in
a simpler spectrum than
15 N labeling. These experiments can be lengthy, require
large amounts of isotopically labeled protein, and give complicated spectra to
interpret making them not ideal for screening large libraries of ligands. However,
both methods have successfully been used to screen for bromodomain inhibitors. For
example, Hasvold et al. used
1 H13 C-HSQC to screen 18,000 fragments in mixtures
of 30 leading to a novel methyl pyrrole inhibitor of BET bromodomains [81]. Harner
et al. screened 13,800 fragments against ADTAD2 using
1 H15 N-SOFAST-HMQC
(Fig. 10) [82]. More commonly, an assigned
1 H15 N-HSQC protein spectrum is used
Fig. 10 Example overlays of 2D-NMR spectra. Blue ovals emphasize shifts of protein resonances
when a ligand is (red) and is not (black) present in the sample. (a)
1
H–
15 N SOFAST-HMQC for
ligand discovery ATAD2. Adapted with permission from Harner et al. (b)
1
H–
13
C-HSQC for ligand
discovery for BRD4 BD2. Adapted with permission from Hasvold et al. permission pending
310
W. C. K. Pomerantz et al.