

83
3.5.3 Impact of the Millennium Development Goals
While the halving or 50% reductions of the MDGs were not achieved for the four
metrics, significant progress was made between 2000 and 2015:
• 31% reduction in the prevalence of underweight children under 5 years of age
• 28% reduction in the proportion of population below minimum level of dietary
energy consumption
• 42% reduction in the proportion of the population using an improved drinking
water source
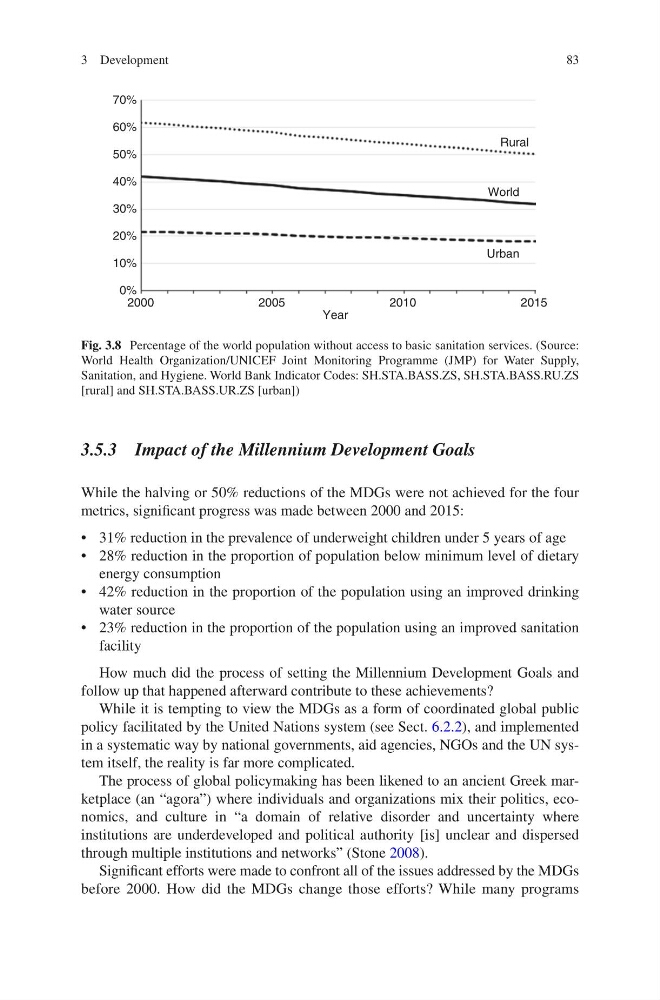
• 23% reduction in the proportion of the population using an improved sanitation
facility
How much did the process of setting the Millennium Development Goals and
follow up that happened afterward contribute to these achievements?
While it is tempting to view the MDGs as a form of coordinated global public
policy facilitated by the United Nations system (see Sect. 6.2.2), and implemented
in a systematic way by national governments, aid agencies, NGOs and the UN system itself, the reality is far more complicated.
The process of global policymaking has been likened to an ancient Greek marketplace (an “agora”) where individuals and organizations mix their politics, economics, and culture in “a domain of relative disorder and uncertainty where
institutions are underdeveloped and political authority [is] unclear and dispersed
through multiple institutions and networks” (Stone 2008).
Significant efforts were made to confront all of the issues addressed by the MDGs
before 2000. How did the MDGs change those efforts? While many programs
0%
2000
Year
Urban
World
Rural
2005
2010
2015
10%
20%
30%
40%
50%
60%
70%
Fig. 3.8 Percentage of the world population without access to basic sanitation services. (Source:
World Health Organization/UNICEF Joint Monitoring Programme (JMP) for Water Supply,
Sanitation, and Hygiene. World Bank Indicator Codes: SH.STA.BASS.ZS, SH.STA.BASS.RU.ZS
[rural] and SH.STA.BASS.UR.ZS [urban])
3 Development
3.5.3 Impact of the Millennium Development Goals
While the halving or 50% reductions of the MDGs were not achieved for the four
metrics, significant progress was made between 2000 and 2015:
• 31% reduction in the prevalence of underweight children under 5 years of age
• 28% reduction in the proportion of population below minimum level of dietary
energy consumption
• 42% reduction in the proportion of the population using an improved drinking
water source
• 23% reduction in the proportion of the population using an improved sanitation
facility
How much did the process of setting the Millennium Development Goals and
follow up that happened afterward contribute to these achievements?
While it is tempting to view the MDGs as a form of coordinated global public
policy facilitated by the United Nations system (see Sect. 6.2.2), and implemented
in a systematic way by national governments, aid agencies, NGOs and the UN system itself, the reality is far more complicated.
The process of global policymaking has been likened to an ancient Greek marketplace (an “agora”) where individuals and organizations mix their politics, economics, and culture in “a domain of relative disorder and uncertainty where
institutions are underdeveloped and political authority [is] unclear and dispersed
through multiple institutions and networks” (Stone 2008).
Significant efforts were made to confront all of the issues addressed by the MDGs
before 2000. How did the MDGs change those efforts? While many programs
0%
2000
Year
Urban
World
Rural
2005
2010
2015
10%
20%
30%
40%
50%
60%
70%
Fig. 3.8 Percentage of the world population without access to basic sanitation services. (Source:
World Health Organization/UNICEF Joint Monitoring Programme (JMP) for Water Supply,
Sanitation, and Hygiene. World Bank Indicator Codes: SH.STA.BASS.ZS, SH.STA.BASS.RU.ZS
[rural] and SH.STA.BASS.UR.ZS [urban])
3 Development