

470
Along with the interactive clustering, enabling sensitivity analysis can be done
by creating a metric on how elements change groupings from one classification
scheme to another. This will allow analysts to determine the sensitivity of elements
to changes in the different distance functions used by various classification algorithms. This sensitivity can be used to assign certainty values to cluster groupings,
which could then be visualized or used as variables in regression models and other
advanced analyses.
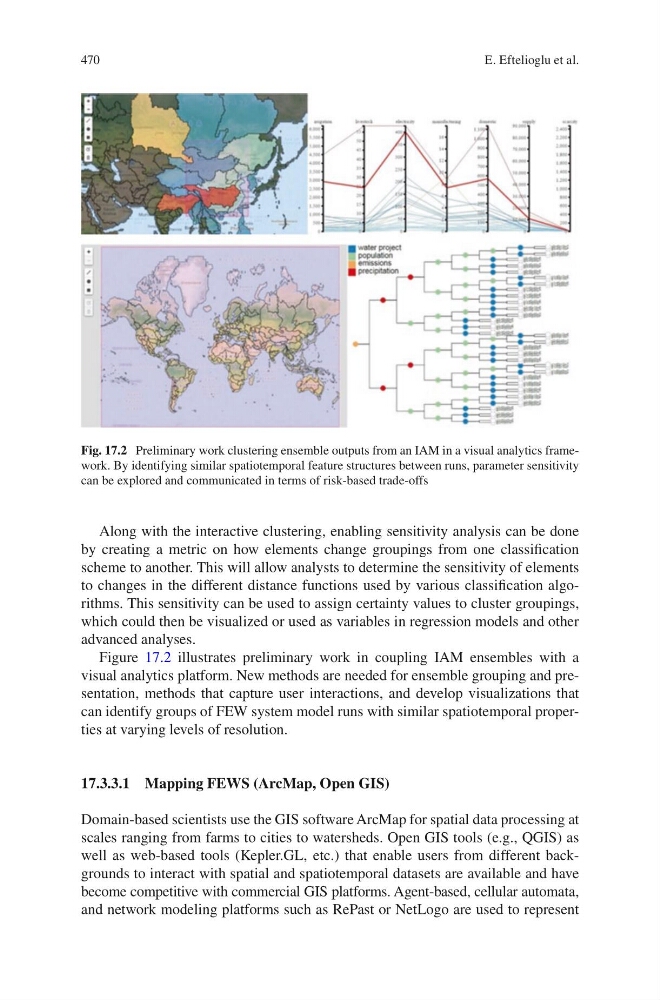
Figure 17.2 illustrates preliminary work in coupling IAM ensembles with a
visual analytics platform. New methods are needed for ensemble grouping and presentation, methods that capture user interactions, and develop visualizations that
can identify groups of FEW system model runs with similar spatiotemporal properties at varying levels of resolution.
17.3.3.1 Mapping FEWS (ArcMap, Open GIS)
Domain-based scientists use the GIS software ArcMap for spatial data processing at
scales ranging from farms to cities to watersheds. Open GIS tools (e.g., QGIS) as
well as web-based tools (Kepler.GL, etc.) that enable users from different backgrounds to interact with spatial and spatiotemporal datasets are available and have
become competitive with commercial GIS platforms. Agent-based, cellular automata,
and network modeling platforms such as RePast or NetLogo are used to represent
Fig. 17.2 Preliminary work clustering ensemble outputs from an IAM in a visual analytics framework. By identifying similar spatiotemporal feature structures between runs, parameter sensitivity
can be explored and communicated in terms of risk-based trade-offs
E. Eftelioglu et al.
Along with the interactive clustering, enabling sensitivity analysis can be done
by creating a metric on how elements change groupings from one classification
scheme to another. This will allow analysts to determine the sensitivity of elements
to changes in the different distance functions used by various classification algorithms. This sensitivity can be used to assign certainty values to cluster groupings,
which could then be visualized or used as variables in regression models and other
advanced analyses.
Figure 17.2 illustrates preliminary work in coupling IAM ensembles with a
visual analytics platform. New methods are needed for ensemble grouping and presentation, methods that capture user interactions, and develop visualizations that
can identify groups of FEW system model runs with similar spatiotemporal properties at varying levels of resolution.
17.3.3.1 Mapping FEWS (ArcMap, Open GIS)
Domain-based scientists use the GIS software ArcMap for spatial data processing at
scales ranging from farms to cities to watersheds. Open GIS tools (e.g., QGIS) as
well as web-based tools (Kepler.GL, etc.) that enable users from different backgrounds to interact with spatial and spatiotemporal datasets are available and have
become competitive with commercial GIS platforms. Agent-based, cellular automata,
and network modeling platforms such as RePast or NetLogo are used to represent
Fig. 17.2 Preliminary work clustering ensemble outputs from an IAM in a visual analytics framework. By identifying similar spatiotemporal feature structures between runs, parameter sensitivity
can be explored and communicated in terms of risk-based trade-offs
E. Eftelioglu et al.