

359
sumption, for example by comparing it to historical situations (e.g., drought),
estimates of resource size (e.g., rainfall, water storage, fossil reserves, grain storage), or values of peers.
For the example of the city targeting 20 ML/day, it is critical for stakeholders in
water planning to know the relative change (e.g., % relative to baseline year) of both
total city-wide and per capita consumption, and whether each has increased or
decreased over time.
Further, describing the water consumption of a city or farm as a fraction of the
total consumption in a river basin is a common way to describe water allocation. A
city, state, or country might decrease its per capita consumption of food, energy, or
water over time even when its total consumption of each might increase due to
increased population.
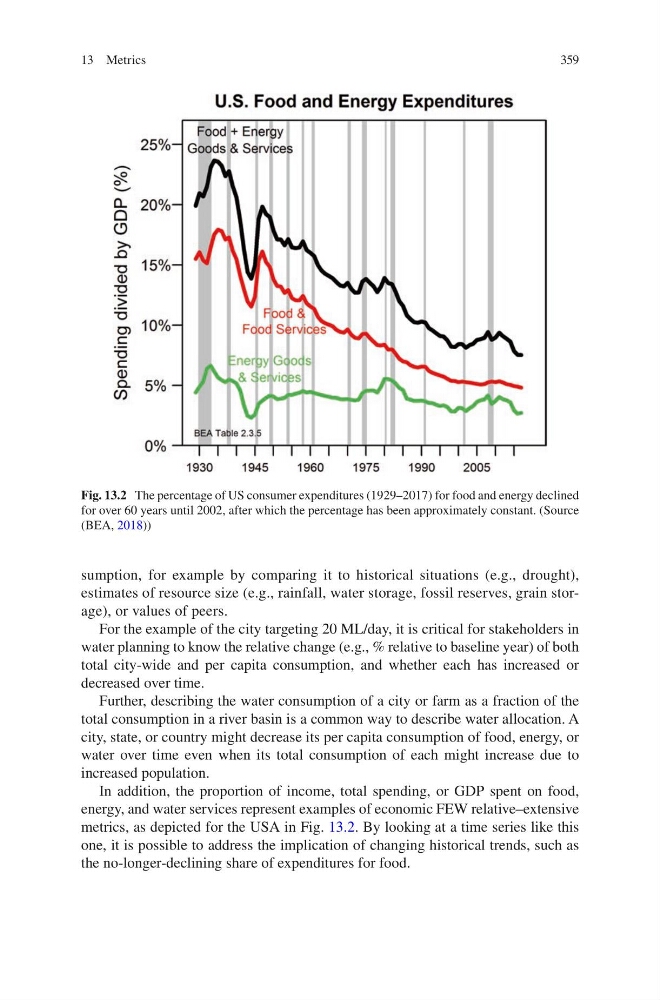
In addition, the proportion of income, total spending, or GDP spent on food,
energy, and water services represent examples of economic FEW relative–extensive
metrics, as depicted for the USA in Fig. 13.2. By looking at a time series like this
one, it is possible to address the implication of changing historical trends, such as
the no-longer-declining share of expenditures for food.
Fig. 13.2 The percentage of US consumer expenditures (1929–2017) for food and energy declined
for over 60 years until 2002, after which the percentage has been approximately constant. (Source
(BEA, 2018))
13 Metrics
sumption, for example by comparing it to historical situations (e.g., drought),
estimates of resource size (e.g., rainfall, water storage, fossil reserves, grain storage), or values of peers.
For the example of the city targeting 20 ML/day, it is critical for stakeholders in
water planning to know the relative change (e.g., % relative to baseline year) of both
total city-wide and per capita consumption, and whether each has increased or
decreased over time.
Further, describing the water consumption of a city or farm as a fraction of the
total consumption in a river basin is a common way to describe water allocation. A
city, state, or country might decrease its per capita consumption of food, energy, or
water over time even when its total consumption of each might increase due to
increased population.
In addition, the proportion of income, total spending, or GDP spent on food,
energy, and water services represent examples of economic FEW relative–extensive
metrics, as depicted for the USA in Fig. 13.2. By looking at a time series like this
one, it is possible to address the implication of changing historical trends, such as
the no-longer-declining share of expenditures for food.
Fig. 13.2 The percentage of US consumer expenditures (1929–2017) for food and energy declined
for over 60 years until 2002, after which the percentage has been approximately constant. (Source
(BEA, 2018))
13 Metrics