

358
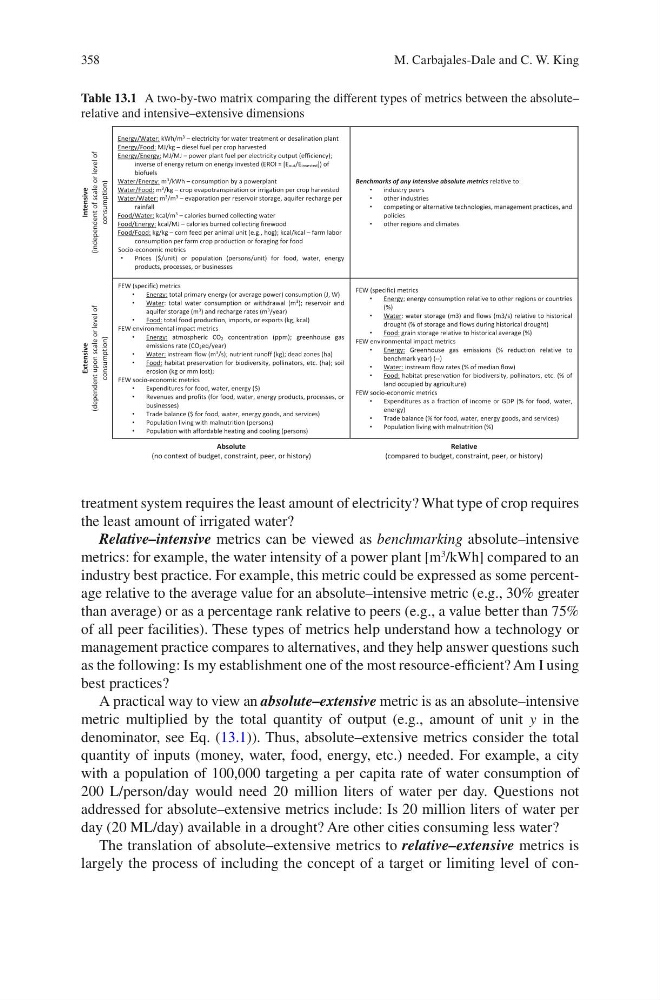
Table 13.1 A two-by-two matrix comparing the different types of metrics between the absolute–
relative and intensive–extensive dimensions
Intensive
f
o
l
e
v
e
l
r
o
e
l
a
c
s
f
o
t
n
e
d
n
e
p
e
d
n
i
(
)
n
o
i
t
p
m
u
s
n
o
c
Energy/Water: kWh/m 3 – electricity for water treatment or desalination plant
Energy/Food: MJ/kg – diesel fuel per crop harvested
Energy/Energy: MJ/MJ – power plant fuel per electricity output (efficiency);
inverse of energy return on energy invested (EROI = [Eout/Einvested]) of
biofuels
Water/Energy: m 3 /kWh – consumption by a powerplant
Water/Food: m 3 /kg – crop evapotranspiration or irrigation per crop harvested
Water/Water: m 3 /m 3 – evaporation per reservoir storage, aquifer recharge per
rainfall
Food/Water: kcal/m 3 – calories burned collecting water
Food/Energy: kcal/MJ – calories burned collecting firewood
Food/Food: kg/kg – corn feed per animal unit (e.g., hog); kcal/kcal – farm labor
consumption per farm crop production or foraging for food
Socio-economic metrics
•
Prices ($/unit) or population (persons/unit) for food, water, energy
products, processes, or businesses
Benchmarks of any intensive absolute metrics relative to:
•
industry peers
•
other industries
•
competing or alternative technologies, management practices, and
policies
•
other regions and climates
Extensive
f
o
l
e
v
e
l
r
o
e
l
a
c
s
n
o
p
u
t
n
e
d
n
e
p
e
d
(
)
n
o
i
t
p
m
u
s
n
o
c
FEW (specific) metrics
•
Energy: total primary energy (or average power) consumption (J, W)
•
Water: total water consumption or withdrawal (m 3 ); reservoir and
aquifer storage (m 3 ) and recharge rates (m 3 /year)
•
Food: total food production, imports, or exports (kg, kcal)
FEW environmental impact metrics
•
Energy: atmospheric CO2 concentration (ppm); greenhouse gas
emissions rate (CO2eq/year)
•
Water: instream flow (m 3 /s); nutrient runoff (kg); dead zones (ha)
•
Food: habitat preservation for biodiversity, pollinators, etc. (ha); soil
erosion (kg or mm lost);
FEW socio-economic metrics
•
Expenditures for food, water, energy ($)
•
Revenues and profits (for food, water, energy products, processes, or
businesses)
•
Trade balance ($ for food, water, energy goods, and services)
•
Population living with malnutrition (persons)
•
Population with affordable heating and cooling (persons)
FEW (specific) metrics
•
Energy: energy consumption relative to other regions or countries
(%)
•
Water: water storage (m3) and flows (m3/s) relative to historical
drought (% of storage and flows during historical drought)
•
Food: grain storage relative to historical average (%)
FEW environmental impact metrics
•
Energy: Greenhouse gas emissions (% reduction relative to
benchmark year) (--)
•
Water: instream flow rates (% of median flow)
•
Food: habitat preservation for biodiversity, pollinators, etc. (% of
land occupied by agriculture)
FEW socio-economic metrics
•
Expenditures as a fraction of income or GDP (% for food, water,
energy)
•
Trade balance (% for food, water, energy goods, and services)
•
Population living with malnutrition (%)
Absolute
(no context of budget, constraint, peer, or history)
Relative
(compared to budget, constraint, peer, or history)
treatment system requires the least amount of electricity? What type of crop requires
the least amount of irrigated water?
Relative–intensive metrics can be viewed as benchmarking absolute–intensive
metrics: for example, the water intensity of a power plant [m
3
/kWh] compared to an
industry best practice. For example, this metric could be expressed as some percentage relative to the average value for an absolute–intensive metric (e.g., 30% greater
than average) or as a percentage rank relative to peers (e.g., a value better than 75%
of all peer facilities). These types of metrics help understand how a technology or
management practice compares to alternatives, and they help answer questions such
as the following: Is my establishment one of the most resource-efficient? Am I using
best practices?
A practical way to view an absolute–extensive metric is as an absolute–intensive
metric multiplied by the total quantity of output (e.g., amount of unit y in the
denominator, see Eq. (13.1)). Thus, absolute–extensive metrics consider the total
quantity of inputs (money, water, food, energy, etc.) needed. For example, a city
with a population of 100,000 targeting a per capita rate of water consumption of
200 L/person/day would need 20 million liters of water per day. Questions not
addressed for absolute–extensive metrics include: Is 20 million liters of water per
day (20 ML/day) available in a drought? Are other cities consuming less water?
The translation of absolute–extensive metrics to relative–extensive metrics is
largely the process of including the concept of a target or limiting level of conM. Carbajales-Dale and C. W. King
Table 13.1 A two-by-two matrix comparing the different types of metrics between the absolute–
relative and intensive–extensive dimensions
Intensive
f
o
l
e
v
e
l
r
o
e
l
a
c
s
f
o
t
n
e
d
n
e
p
e
d
n
i
(
)
n
o
i
t
p
m
u
s
n
o
c
Energy/Water: kWh/m 3 – electricity for water treatment or desalination plant
Energy/Food: MJ/kg – diesel fuel per crop harvested
Energy/Energy: MJ/MJ – power plant fuel per electricity output (efficiency);
inverse of energy return on energy invested (EROI = [Eout/Einvested]) of
biofuels
Water/Energy: m 3 /kWh – consumption by a powerplant
Water/Food: m 3 /kg – crop evapotranspiration or irrigation per crop harvested
Water/Water: m 3 /m 3 – evaporation per reservoir storage, aquifer recharge per
rainfall
Food/Water: kcal/m 3 – calories burned collecting water
Food/Energy: kcal/MJ – calories burned collecting firewood
Food/Food: kg/kg – corn feed per animal unit (e.g., hog); kcal/kcal – farm labor
consumption per farm crop production or foraging for food
Socio-economic metrics
•
Prices ($/unit) or population (persons/unit) for food, water, energy
products, processes, or businesses
Benchmarks of any intensive absolute metrics relative to:
•
industry peers
•
other industries
•
competing or alternative technologies, management practices, and
policies
•
other regions and climates
Extensive
f
o
l
e
v
e
l
r
o
e
l
a
c
s
n
o
p
u
t
n
e
d
n
e
p
e
d
(
)
n
o
i
t
p
m
u
s
n
o
c
FEW (specific) metrics
•
Energy: total primary energy (or average power) consumption (J, W)
•
Water: total water consumption or withdrawal (m 3 ); reservoir and
aquifer storage (m 3 ) and recharge rates (m 3 /year)
•
Food: total food production, imports, or exports (kg, kcal)
FEW environmental impact metrics
•
Energy: atmospheric CO2 concentration (ppm); greenhouse gas
emissions rate (CO2eq/year)
•
Water: instream flow (m 3 /s); nutrient runoff (kg); dead zones (ha)
•
Food: habitat preservation for biodiversity, pollinators, etc. (ha); soil
erosion (kg or mm lost);
FEW socio-economic metrics
•
Expenditures for food, water, energy ($)
•
Revenues and profits (for food, water, energy products, processes, or
businesses)
•
Trade balance ($ for food, water, energy goods, and services)
•
Population living with malnutrition (persons)
•
Population with affordable heating and cooling (persons)
FEW (specific) metrics
•
Energy: energy consumption relative to other regions or countries
(%)
•
Water: water storage (m3) and flows (m3/s) relative to historical
drought (% of storage and flows during historical drought)
•
Food: grain storage relative to historical average (%)
FEW environmental impact metrics
•
Energy: Greenhouse gas emissions (% reduction relative to
benchmark year) (--)
•
Water: instream flow rates (% of median flow)
•
Food: habitat preservation for biodiversity, pollinators, etc. (% of
land occupied by agriculture)
FEW socio-economic metrics
•
Expenditures as a fraction of income or GDP (% for food, water,
energy)
•
Trade balance (% for food, water, energy goods, and services)
•
Population living with malnutrition (%)
Absolute
(no context of budget, constraint, peer, or history)
Relative
(compared to budget, constraint, peer, or history)
treatment system requires the least amount of electricity? What type of crop requires
the least amount of irrigated water?
Relative–intensive metrics can be viewed as benchmarking absolute–intensive
metrics: for example, the water intensity of a power plant [m
3
/kWh] compared to an
industry best practice. For example, this metric could be expressed as some percentage relative to the average value for an absolute–intensive metric (e.g., 30% greater
than average) or as a percentage rank relative to peers (e.g., a value better than 75%
of all peer facilities). These types of metrics help understand how a technology or
management practice compares to alternatives, and they help answer questions such
as the following: Is my establishment one of the most resource-efficient? Am I using
best practices?
A practical way to view an absolute–extensive metric is as an absolute–intensive
metric multiplied by the total quantity of output (e.g., amount of unit y in the
denominator, see Eq. (13.1)). Thus, absolute–extensive metrics consider the total
quantity of inputs (money, water, food, energy, etc.) needed. For example, a city
with a population of 100,000 targeting a per capita rate of water consumption of
200 L/person/day would need 20 million liters of water per day. Questions not
addressed for absolute–extensive metrics include: Is 20 million liters of water per
day (20 ML/day) available in a drought? Are other cities consuming less water?
The translation of absolute–extensive metrics to relative–extensive metrics is
largely the process of including the concept of a target or limiting level of conM. Carbajales-Dale and C. W. King