

198
limited use of other sources. In response to the oil crisis of 1973, nations such as
Japan, France, Germany, and the USA all expanded their use of nuclear power to
reduce their dependence on petroleum imports. Countries with large natural
hydropower capacity, such as Brazil and Canada, have developed them, and they
reflect a high share of their energy use.
Petroleum and natural gas are naturally created in the same manner are found in
closely associated locations. Production of crude oil and natural gas usually includes
some level of production of the other. In 2018, 28% of US petroleum field production
was in the form of Natural Gas Liquids.
Production of petroleum and natural gas is dominated by a relatively small number of countries (Fig. 7.6). Three countries accounted for 39% of crude oil production in 2017 (USA 14%, Saudi Arabia 13%, and the Russian Federation 12%).
Three-quarters of crude oil production occurred in just 13 countries, and 39 countries accounted for 98% of production. The USA (20%) and the Russian Federation
(17%) account for 37% of global natural gas production. Three-quarters of natural
gas production occurred in 13 countries, and 41 countries accounted for 98% of
production.
Table 7.2 summarizes global trade in petroleum and natural gas in 2017. A critical point to understand about oil trading is that crude oil is a blend of hydrocarbons and, therefore, a range of products. Fuels for automobiles, large trucks,
aircraft, and ships are all derived from different hydrocarbons contained in crude
oil. Each source of crude oil has a unique blend of hydrocarbons. Therefore, even
when a country produces as much crude oil as it consumes, it will be still be
involved in trading—exporting the hydrocarbons that it has a surfeit of and importing those in which it has a deficit. Further, some trading is associated with refining
capacity. For example, the USA has significant excess capacity to refine heavy
1967
0
2,000
4,000
6,000
8,000
10,000
12,000
14,000
Primary Energy Consumption
Million tonnes oil equivalent
1977
1987
1997
Year
2007
Oil
Natural Gas
Coal
Other Renewables
Hydroelectricity
Nuclear
2017
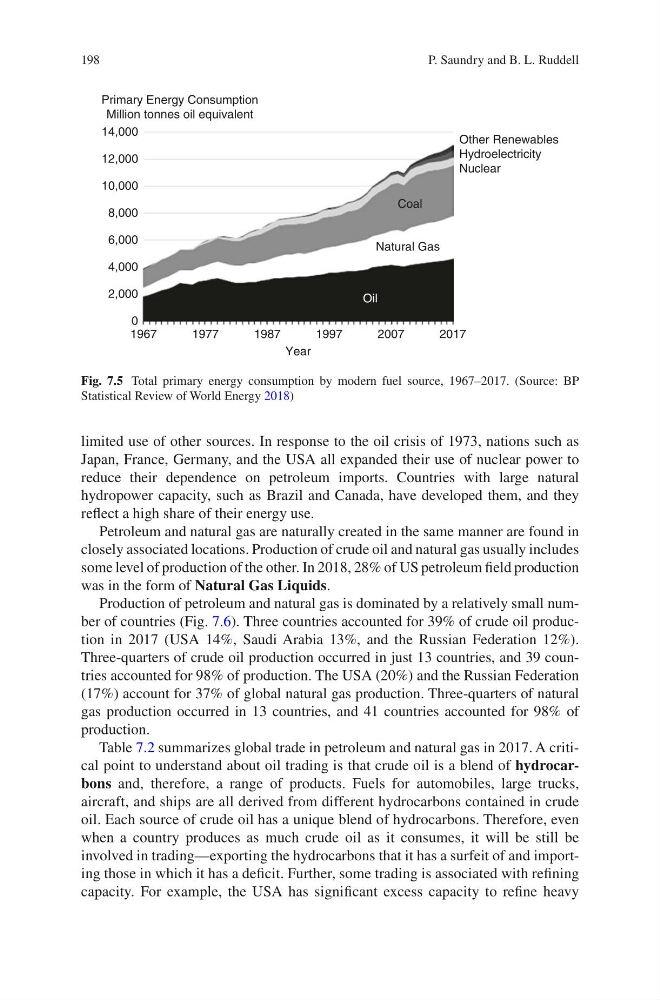
Fig. 7.5 Total primary energy consumption by modern fuel source, 1967–2017. (Source: BP
Statistical Review of World Energy 2018)
P. Saundry and B. L. Ruddell
limited use of other sources. In response to the oil crisis of 1973, nations such as
Japan, France, Germany, and the USA all expanded their use of nuclear power to
reduce their dependence on petroleum imports. Countries with large natural
hydropower capacity, such as Brazil and Canada, have developed them, and they
reflect a high share of their energy use.
Petroleum and natural gas are naturally created in the same manner are found in
closely associated locations. Production of crude oil and natural gas usually includes
some level of production of the other. In 2018, 28% of US petroleum field production
was in the form of Natural Gas Liquids.
Production of petroleum and natural gas is dominated by a relatively small number of countries (Fig. 7.6). Three countries accounted for 39% of crude oil production in 2017 (USA 14%, Saudi Arabia 13%, and the Russian Federation 12%).
Three-quarters of crude oil production occurred in just 13 countries, and 39 countries accounted for 98% of production. The USA (20%) and the Russian Federation
(17%) account for 37% of global natural gas production. Three-quarters of natural
gas production occurred in 13 countries, and 41 countries accounted for 98% of
production.
Table 7.2 summarizes global trade in petroleum and natural gas in 2017. A critical point to understand about oil trading is that crude oil is a blend of hydrocarbons and, therefore, a range of products. Fuels for automobiles, large trucks,
aircraft, and ships are all derived from different hydrocarbons contained in crude
oil. Each source of crude oil has a unique blend of hydrocarbons. Therefore, even
when a country produces as much crude oil as it consumes, it will be still be
involved in trading—exporting the hydrocarbons that it has a surfeit of and importing those in which it has a deficit. Further, some trading is associated with refining
capacity. For example, the USA has significant excess capacity to refine heavy
1967
0
2,000
4,000
6,000
8,000
10,000
12,000
14,000
Primary Energy Consumption
Million tonnes oil equivalent
1977
1987
1997
Year
2007
Oil
Natural Gas
Coal
Other Renewables
Hydroelectricity
Nuclear
2017
Fig. 7.5 Total primary energy consumption by modern fuel source, 1967–2017. (Source: BP
Statistical Review of World Energy 2018)
P. Saundry and B. L. Ruddell