

28
System models can be classified into three
fundamental groups:
1. Modelling system structure,
2. Modelling system operation and internal
processes,
3. Modelling system behaviour and changes in
time.
Changes in the system in most cases can be
quantified. In scientific research the behaviour of
systems is described by mathematical equations
forming mathematical models. The methodological
background of mathematics is endless in this field
as well therefore no attempt is made to discuss them
although complex system models made by major
computer apparatus will be cited later (Sect. 2.6.2).
Here an example is given to illustrate that sometimes simple equations are appropriate to illustrate
the complex behaviour of a given system.
The Malthus equation describing population
growth is a relatively wide known approach that
can be used for animal populations as well
Xn rX
=
where Xn = number of people in the next year,
X = population in this year, r = ratio of population
growth.
Let us imagine an animal population reproducing fast. Let us take r = 1.1 so, for example, a
population of 1000 members will increase to
1100 in the next year. If no hindering factors are
present then this linear growth function will
increase for ever resulting in an immeasurable
population size. We know, however, that this is
not the case in reality (carnivorous animals exist,
diseases occur, food can be limited, etc.) thus this
equation describes the changes of the system not
completely accurately. Let us modify the equation (Eq. 2.1) so that an element is integrated that
limits growth.
Xn rX
X
=
−
(
)
1
(2.1)
1 − X limits growth because if X grows 1 − X
decreases. Particular calculations based on the
equation indicated that if ‘r’ is smaller than three
the population will increase fast initially then
numbers will alter up and down and finally will
be stabilised at a value. In ‘r’ is below three but
increases gradually then the stable value of the
members in the population will be higher. This is
roughly the same as the changes in the number of
individuals in a given population (Fig. 2.11). If,
however, the value of ‘r’ increases above three
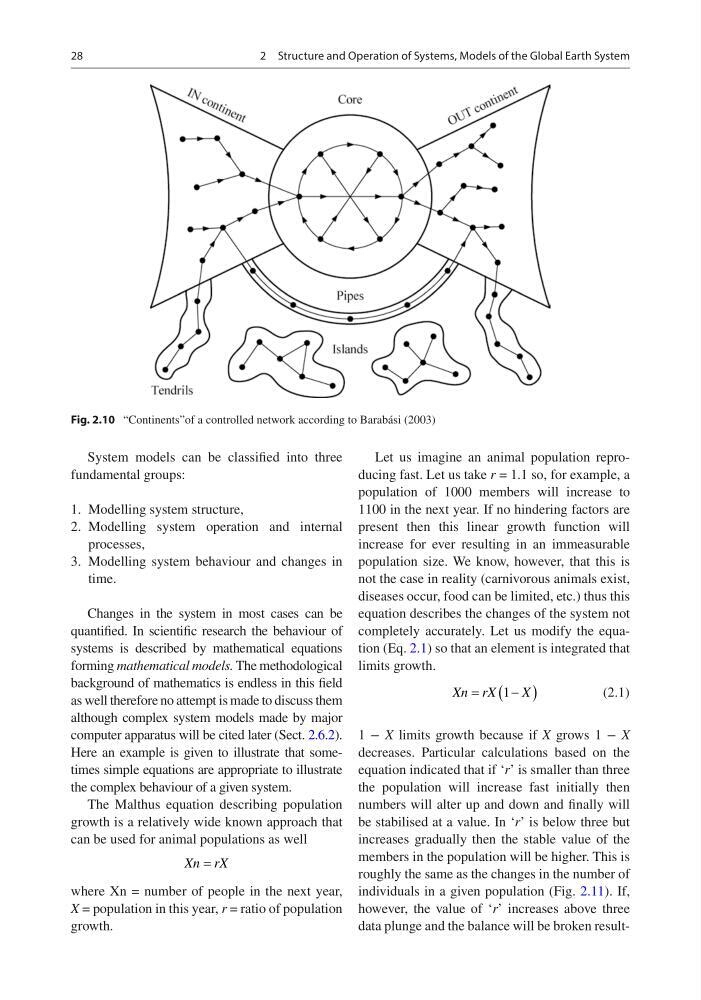
data plunge and the balance will be broken resultFig. 2.10 “Continents”of a controlled network according to Barabási (2003)
2 Structure and Operation of Systems, Models of the Global Earth System
System models can be classified into three
fundamental groups:
1. Modelling system structure,
2. Modelling system operation and internal
processes,
3. Modelling system behaviour and changes in
time.
Changes in the system in most cases can be
quantified. In scientific research the behaviour of
systems is described by mathematical equations
forming mathematical models. The methodological
background of mathematics is endless in this field
as well therefore no attempt is made to discuss them
although complex system models made by major
computer apparatus will be cited later (Sect. 2.6.2).
Here an example is given to illustrate that sometimes simple equations are appropriate to illustrate
the complex behaviour of a given system.
The Malthus equation describing population
growth is a relatively wide known approach that
can be used for animal populations as well
Xn rX
=
where Xn = number of people in the next year,
X = population in this year, r = ratio of population
growth.
Let us imagine an animal population reproducing fast. Let us take r = 1.1 so, for example, a
population of 1000 members will increase to
1100 in the next year. If no hindering factors are
present then this linear growth function will
increase for ever resulting in an immeasurable
population size. We know, however, that this is
not the case in reality (carnivorous animals exist,
diseases occur, food can be limited, etc.) thus this
equation describes the changes of the system not
completely accurately. Let us modify the equation (Eq. 2.1) so that an element is integrated that
limits growth.
Xn rX
X
=
−
(
)
1
(2.1)
1 − X limits growth because if X grows 1 − X
decreases. Particular calculations based on the
equation indicated that if ‘r’ is smaller than three
the population will increase fast initially then
numbers will alter up and down and finally will
be stabilised at a value. In ‘r’ is below three but
increases gradually then the stable value of the
members in the population will be higher. This is
roughly the same as the changes in the number of
individuals in a given population (Fig. 2.11). If,
however, the value of ‘r’ increases above three
data plunge and the balance will be broken resultFig. 2.10 “Continents”of a controlled network according to Barabási (2003)
2 Structure and Operation of Systems, Models of the Global Earth System