

186
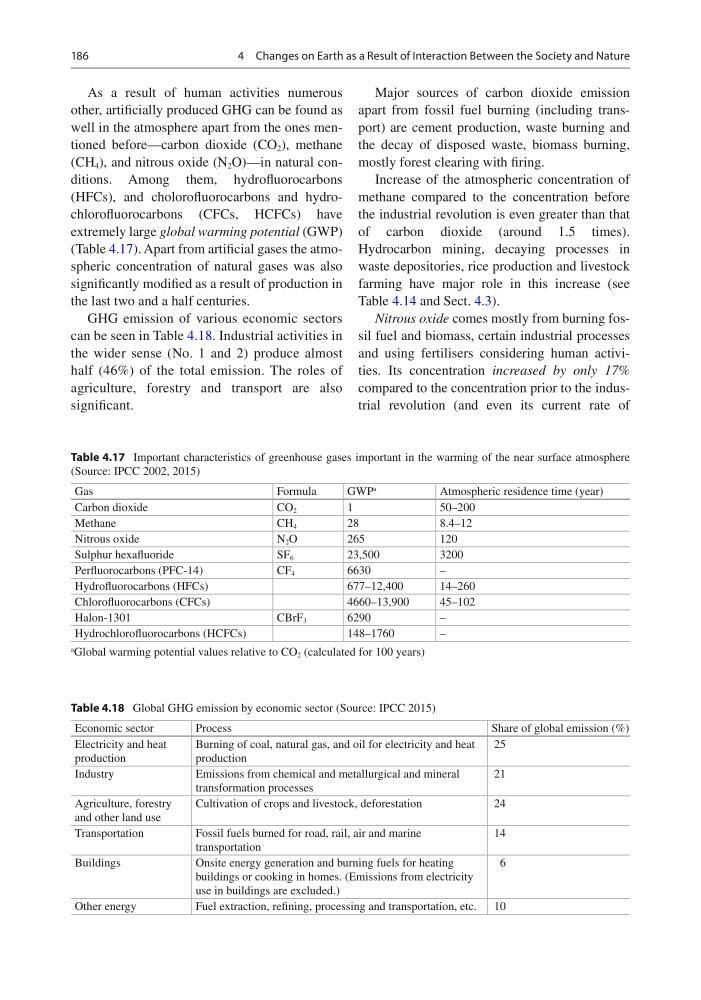
As a result of human activities numerous
other, artificially produced GHG can be found as
well in the atmosphere apart from the ones mentioned before—carbon dioxide (CO 2 ), methane
(CH 4 ), and nitrous oxide (N 2 O)—in natural conditions. Among them, hydrofluorocarbons
(HFCs), and cholorofluorocarbons and hydrochlorofluorocarbons (CFCs, HCFCs) have
extremely large global warming potential (GWP)
(Table 4.17). Apart from artificial gases the atmospheric concentration of natural gases was also
significantly modified as a result of production in
the last two and a half centuries.
GHG emission of various economic sectors
can be seen in Table 4.18. Industrial activities in
the wider sense (No. 1 and 2) produce almost
half (46%) of the total emission. The roles of
agriculture, forestry and transport are also
significant.
Major sources of carbon dioxide emission
apart from fossil fuel burning (including transport) are cement production, waste burning and
the decay of disposed waste, biomass burning,
mostly forest clearing with firing.
Increase of the atmospheric concentration of
methane compared to the concentration before
the industrial revolution is even greater than that
of carbon dioxide (around 1.5 times).
Hydrocarbon mining, decaying processes in
waste depositories, rice production and livestock
farming have major role in this increase (see
Table 4.14 and Sect. 4.3).
Nitrous oxide comes mostly from burning fossil fuel and biomass, certain industrial processes
and using fertilisers considering human activities. Its concentration increased by only 17%
compared to the concentration prior to the industrial revolution (and even its current rate of
Table 4.17 Important characteristics of greenhouse gases important in the warming of the near surface atmosphere
(Source: IPCC 2002, 2015)
Gas
Formula
GWP
a
Atmospheric residence time (year)
Carbon dioxide
CO 2
1
50–200
Methane
CH 4
28
8.4–12
Nitrous oxide
N 2 O
265
120
Sulphur hexafluoride
SF 6
23,500
3200
Perfluorocarbons (PFC-14)
CF 4
6630
–
Hydrofluorocarbons (HFCs)
677–12,400
14–260
Chlorofluorocarbons (CFCs)
4660–13,900
45–102
Halon-1301
CBrF 3
6290
–
Hydrochlorofluorocarbons (HCFCs)
148–1760
–
a
Global warming potential values relative to CO 2 (calculated for 100 years)
Table 4.18 Global GHG emission by economic sector (Source: IPCC 2015)
Economic sector
Process
Share of global emission (%)
Electricity and heat
production
Burning of coal, natural gas, and oil for electricity and heat
production
25
Industry
Emissions from chemical and metallurgical and mineral
transformation processes
21
Agriculture, forestry
and other land use
Cultivation of crops and livestock, deforestation
24
Transportation
Fossil fuels burned for road, rail, air and marine
transportation
14
Buildings
Onsite energy generation and burning fuels for heating
buildings or cooking in homes. (Emissions from electricity
use in buildings are excluded.)
6
Other energy
Fuel extraction, refining, processing and transportation, etc. 10
4 Changes on Earth as a Result of Interaction Between the Society and Nature
As a result of human activities numerous
other, artificially produced GHG can be found as
well in the atmosphere apart from the ones mentioned before—carbon dioxide (CO 2 ), methane
(CH 4 ), and nitrous oxide (N 2 O)—in natural conditions. Among them, hydrofluorocarbons
(HFCs), and cholorofluorocarbons and hydrochlorofluorocarbons (CFCs, HCFCs) have
extremely large global warming potential (GWP)
(Table 4.17). Apart from artificial gases the atmospheric concentration of natural gases was also
significantly modified as a result of production in
the last two and a half centuries.
GHG emission of various economic sectors
can be seen in Table 4.18. Industrial activities in
the wider sense (No. 1 and 2) produce almost
half (46%) of the total emission. The roles of
agriculture, forestry and transport are also
significant.
Major sources of carbon dioxide emission
apart from fossil fuel burning (including transport) are cement production, waste burning and
the decay of disposed waste, biomass burning,
mostly forest clearing with firing.
Increase of the atmospheric concentration of
methane compared to the concentration before
the industrial revolution is even greater than that
of carbon dioxide (around 1.5 times).
Hydrocarbon mining, decaying processes in
waste depositories, rice production and livestock
farming have major role in this increase (see
Table 4.14 and Sect. 4.3).
Nitrous oxide comes mostly from burning fossil fuel and biomass, certain industrial processes
and using fertilisers considering human activities. Its concentration increased by only 17%
compared to the concentration prior to the industrial revolution (and even its current rate of
Table 4.17 Important characteristics of greenhouse gases important in the warming of the near surface atmosphere
(Source: IPCC 2002, 2015)
Gas
Formula
GWP
a
Atmospheric residence time (year)
Carbon dioxide
CO 2
1
50–200
Methane
CH 4
28
8.4–12
Nitrous oxide
N 2 O
265
120
Sulphur hexafluoride
SF 6
23,500
3200
Perfluorocarbons (PFC-14)
CF 4
6630
–
Hydrofluorocarbons (HFCs)
677–12,400
14–260
Chlorofluorocarbons (CFCs)
4660–13,900
45–102
Halon-1301
CBrF 3
6290
–
Hydrochlorofluorocarbons (HCFCs)
148–1760
–
a
Global warming potential values relative to CO 2 (calculated for 100 years)
Table 4.18 Global GHG emission by economic sector (Source: IPCC 2015)
Economic sector
Process
Share of global emission (%)
Electricity and heat
production
Burning of coal, natural gas, and oil for electricity and heat
production
25
Industry
Emissions from chemical and metallurgical and mineral
transformation processes
21
Agriculture, forestry
and other land use
Cultivation of crops and livestock, deforestation
24
Transportation
Fossil fuels burned for road, rail, air and marine
transportation
14
Buildings
Onsite energy generation and burning fuels for heating
buildings or cooking in homes. (Emissions from electricity
use in buildings are excluded.)
6
Other energy
Fuel extraction, refining, processing and transportation, etc. 10
4 Changes on Earth as a Result of Interaction Between the Society and Nature