

180
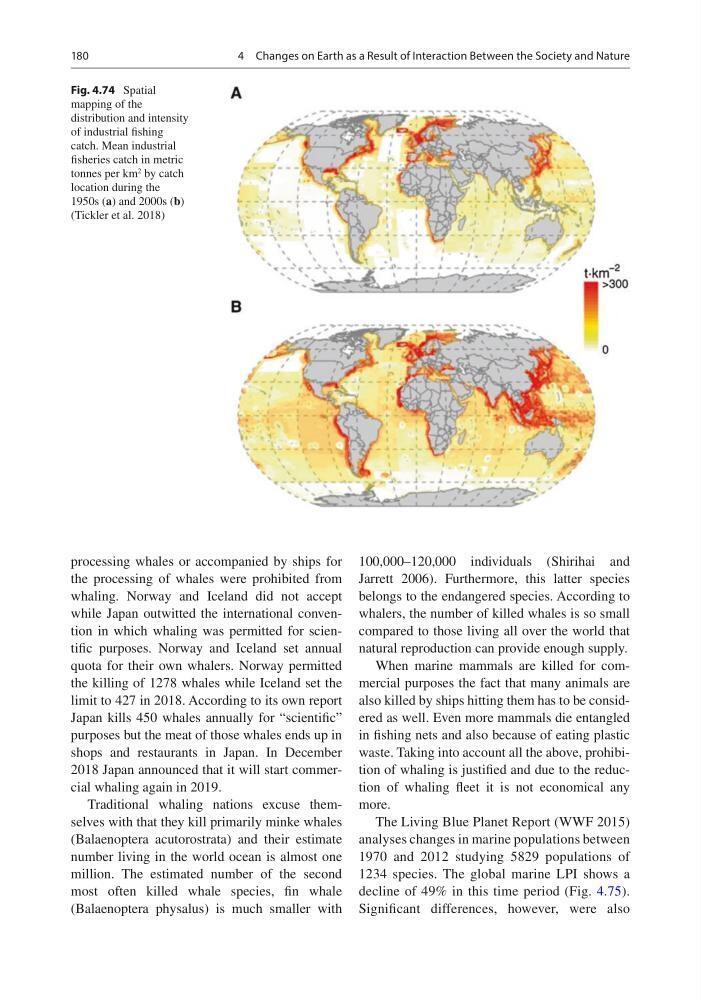
Fig. 4.74 Spatial
mapping of the
distribution and intensity
of industrial fishing
catch. Mean industrial
fisheries catch in metric
tonnes per km
2 by catch
location during the
1950s (a) and 2000s (b)
(Tickler et al. 2018)
processing whales or accompanied by ships for
the processing of whales were prohibited from
whaling. Norway and Iceland did not accept
while Japan outwitted the international convention in which whaling was permitted for scientific purposes. Norway and Iceland set annual
quota for their own whalers. Norway permitted
the killing of 1278 whales while Iceland set the
limit to 427 in 2018. According to its own report
Japan kills 450 whales annually for “scientific”
purposes but the meat of those whales ends up in
shops and restaurants in Japan. In December
2018 Japan announced that it will start commercial whaling again in 2019.
Traditional whaling nations excuse themselves with that they kill primarily minke whales
(Balaenoptera acutorostrata) and their estimate
number living in the world ocean is almost one
million. The estimated number of the second
most often killed whale species, fin whale
(Balaenoptera physalus) is much smaller with
100,000–120,000 individuals (Shirihai and
Jarrett 2006). Furthermore, this latter species
belongs to the endangered species. According to
whalers, the number of killed whales is so small
compared to those living all over the world that
natural reproduction can provide enough supply.
When marine mammals are killed for commercial purposes the fact that many animals are
also killed by ships hitting them has to be considered as well. Even more mammals die entangled
in fishing nets and also because of eating plastic
waste. Taking into account all the above, prohibition of whaling is justified and due to the reduction of whaling fleet it is not economical any
more.
The Living Blue Planet Report (WWF 2015)
analyses changes in marine populations between
1970 and 2012 studying 5829 populations of
1234 species. The global marine LPI shows a
decline of 49% in this time period (Fig. 4.75).
Significant differences, however, were also
4 Changes on Earth as a Result of Interaction Between the Society and Nature
Fig. 4.74 Spatial
mapping of the
distribution and intensity
of industrial fishing
catch. Mean industrial
fisheries catch in metric
tonnes per km
2 by catch
location during the
1950s (a) and 2000s (b)
(Tickler et al. 2018)
processing whales or accompanied by ships for
the processing of whales were prohibited from
whaling. Norway and Iceland did not accept
while Japan outwitted the international convention in which whaling was permitted for scientific purposes. Norway and Iceland set annual
quota for their own whalers. Norway permitted
the killing of 1278 whales while Iceland set the
limit to 427 in 2018. According to its own report
Japan kills 450 whales annually for “scientific”
purposes but the meat of those whales ends up in
shops and restaurants in Japan. In December
2018 Japan announced that it will start commercial whaling again in 2019.
Traditional whaling nations excuse themselves with that they kill primarily minke whales
(Balaenoptera acutorostrata) and their estimate
number living in the world ocean is almost one
million. The estimated number of the second
most often killed whale species, fin whale
(Balaenoptera physalus) is much smaller with
100,000–120,000 individuals (Shirihai and
Jarrett 2006). Furthermore, this latter species
belongs to the endangered species. According to
whalers, the number of killed whales is so small
compared to those living all over the world that
natural reproduction can provide enough supply.
When marine mammals are killed for commercial purposes the fact that many animals are
also killed by ships hitting them has to be considered as well. Even more mammals die entangled
in fishing nets and also because of eating plastic
waste. Taking into account all the above, prohibition of whaling is justified and due to the reduction of whaling fleet it is not economical any
more.
The Living Blue Planet Report (WWF 2015)
analyses changes in marine populations between
1970 and 2012 studying 5829 populations of
1234 species. The global marine LPI shows a
decline of 49% in this time period (Fig. 4.75).
Significant differences, however, were also
4 Changes on Earth as a Result of Interaction Between the Society and Nature