

144
sequences are not only damage to the environment
but serious financial losses for oil companies and
transport companies as well; therefore, these companies do everything they can to avoid the catastrophes. Not only the lost oil and damaged tankers
present costs but the companies have to pay for
cleaning the contaminated coasts and—generally
after trials—local residents and fishing companies
have to be compensated as well. As a result of
technical developments and stricter safety regulations made tanker transport more secure.
Oil stays in the sea for variable time periods:
from a couple of days to several years depending
on the type of oil, the geographical location of the
pollution, the weather at the time of and after the
incident. Usually the degradation of the oil lasts
much longer in cold weather than in warm. The
volatile content of crude oil evaporates generally
within a few days (volatiles make up 25% of
crude oil.) A small part of the remaining oil dissolves while the majority is mixed into seawater
forming emulsion. On a calm water surface oil
forms extensive, continuous, floating patches. If
people do not interfere, microorganisms in natural conditions start the degradation of the oil;
however, this will not be complete. Around 60%
of the oil patches form dense clumps (“tar balls”).
The degradation of these requires a long time;
therefore, it is sensible to remove them from the
water for which several efficient techniques were
developed by experts. The most environmentally
sound procedures are based on physical laws:
they are netted after they were mixed with material of high adsorption capacity.
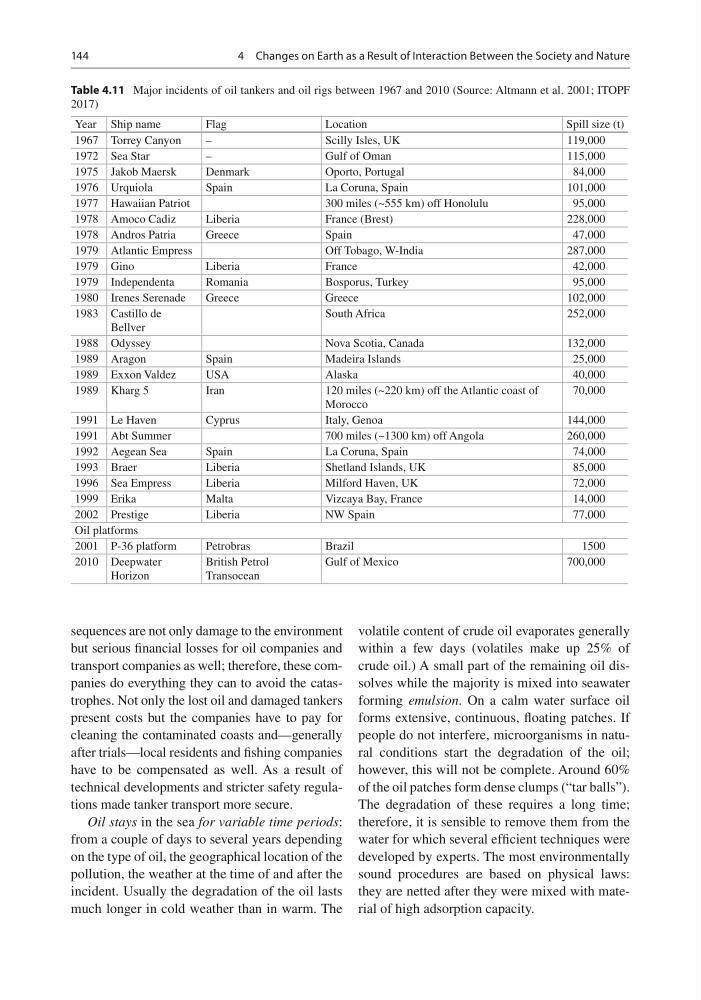
Table 4.11 Major incidents of oil tankers and oil rigs between 1967 and 2010 (Source: Altmann et al. 2001; ITOPF
2017)
Year Ship name
Flag
Location
Spill size (t)
1967 Torrey Canyon
–
Scilly Isles, UK
119,000
1972 Sea Star
–
Gulf of Oman
115,000
1975 Jakob Maersk
Denmark
Oporto, Portugal
84,000
1976 Urquiola
Spain
La Coruna, Spain
101,000
1977 Hawaiian Patriot
300 miles (~555 km) off Honolulu
95,000
1978 Amoco Cadiz
Liberia
France (Brest)
228,000
1978 Andros Patria
Greece
Spain
47,000
1979 Atlantic Empress
Off Tobago, W-India
287,000
1979 Gino
Liberia
France
42,000
1979 Independenta
Romania
Bosporus, Turkey
95,000
1980 Irenes Serenade
Greece
Greece
102,000
1983 Castillo de
Bellver
South Africa
252,000
1988 Odyssey
Nova Scotia, Canada
132,000
1989 Aragon
Spain
Madeira Islands
25,000
1989 Exxon Valdez
USA
Alaska
40,000
1989 Kharg 5
Iran
120 miles (~220 km) off the Atlantic coast of
Morocco
70,000
1991 Le Haven
Cyprus
Italy, Genoa
144,000
1991 Abt Summer
700 miles (~1300 km) off Angola
260,000
1992 Aegean Sea
Spain
La Coruna, Spain
74,000
1993 Braer
Liberia
Shetland Islands, UK
85,000
1996 Sea Empress
Liberia
Milford Haven, UK
72,000
1999 Erika
Malta
Vizcaya Bay, France
14,000
2002 Prestige
Liberia
NW Spain
77,000
Oil platforms
2001 P-36 platform
Petrobras
Brazil
1500
2010 Deepwater
Horizon
British Petrol
Transocean
Gulf of Mexico
700,000
4 Changes on Earth as a Result of Interaction Between the Society and Nature
sequences are not only damage to the environment
but serious financial losses for oil companies and
transport companies as well; therefore, these companies do everything they can to avoid the catastrophes. Not only the lost oil and damaged tankers
present costs but the companies have to pay for
cleaning the contaminated coasts and—generally
after trials—local residents and fishing companies
have to be compensated as well. As a result of
technical developments and stricter safety regulations made tanker transport more secure.
Oil stays in the sea for variable time periods:
from a couple of days to several years depending
on the type of oil, the geographical location of the
pollution, the weather at the time of and after the
incident. Usually the degradation of the oil lasts
much longer in cold weather than in warm. The
volatile content of crude oil evaporates generally
within a few days (volatiles make up 25% of
crude oil.) A small part of the remaining oil dissolves while the majority is mixed into seawater
forming emulsion. On a calm water surface oil
forms extensive, continuous, floating patches. If
people do not interfere, microorganisms in natural conditions start the degradation of the oil;
however, this will not be complete. Around 60%
of the oil patches form dense clumps (“tar balls”).
The degradation of these requires a long time;
therefore, it is sensible to remove them from the
water for which several efficient techniques were
developed by experts. The most environmentally
sound procedures are based on physical laws:
they are netted after they were mixed with material of high adsorption capacity.
Table 4.11 Major incidents of oil tankers and oil rigs between 1967 and 2010 (Source: Altmann et al. 2001; ITOPF
2017)
Year Ship name
Flag
Location
Spill size (t)
1967 Torrey Canyon
–
Scilly Isles, UK
119,000
1972 Sea Star
–
Gulf of Oman
115,000
1975 Jakob Maersk
Denmark
Oporto, Portugal
84,000
1976 Urquiola
Spain
La Coruna, Spain
101,000
1977 Hawaiian Patriot
300 miles (~555 km) off Honolulu
95,000
1978 Amoco Cadiz
Liberia
France (Brest)
228,000
1978 Andros Patria
Greece
Spain
47,000
1979 Atlantic Empress
Off Tobago, W-India
287,000
1979 Gino
Liberia
France
42,000
1979 Independenta
Romania
Bosporus, Turkey
95,000
1980 Irenes Serenade
Greece
Greece
102,000
1983 Castillo de
Bellver
South Africa
252,000
1988 Odyssey
Nova Scotia, Canada
132,000
1989 Aragon
Spain
Madeira Islands
25,000
1989 Exxon Valdez
USA
Alaska
40,000
1989 Kharg 5
Iran
120 miles (~220 km) off the Atlantic coast of
Morocco
70,000
1991 Le Haven
Cyprus
Italy, Genoa
144,000
1991 Abt Summer
700 miles (~1300 km) off Angola
260,000
1992 Aegean Sea
Spain
La Coruna, Spain
74,000
1993 Braer
Liberia
Shetland Islands, UK
85,000
1996 Sea Empress
Liberia
Milford Haven, UK
72,000
1999 Erika
Malta
Vizcaya Bay, France
14,000
2002 Prestige
Liberia
NW Spain
77,000
Oil platforms
2001 P-36 platform
Petrobras
Brazil
1500
2010 Deepwater
Horizon
British Petrol
Transocean
Gulf of Mexico
700,000
4 Changes on Earth as a Result of Interaction Between the Society and Nature