

143
than in previous decades. It has to be noted, however, that many living creatures (algae, larvae of
invertebrates, arthropods, etc.) also travel in the
ballast water and they are released back into the
sea frequently several thousand km away from
their original habitat in completely different ecological conditions. Based on observations, around
90% of them die, 9% accommodate to the new
environment and causes no harm but 1% of them
could be invasive species that may upset the balance of the given local ecosystem causing severe
damage and the elimination of certain species
(Potters 2013).
Competent authorities of the European Union
also considered marine oil transport and created
directives in 2001 aiming to prevent pollution:
controlling the conditions and age of ships, obligatory maintenance, general tightening of controls. According to a report in 2007 the volume of
global oil pollution from ships could be around
457,000 tonnes annually that is less than natural
oil seep (600,000 tonnes/year) and only a fourth
of the value estimated in the 1980s.
Occasional major tanker and oil-rig disasters
are concentrated and shock-like in their environmental effect, therefore these are very dangerous
to nearshore life. Technical advance in recent
years made tankers safer and environmentally
sounder while international legal control also
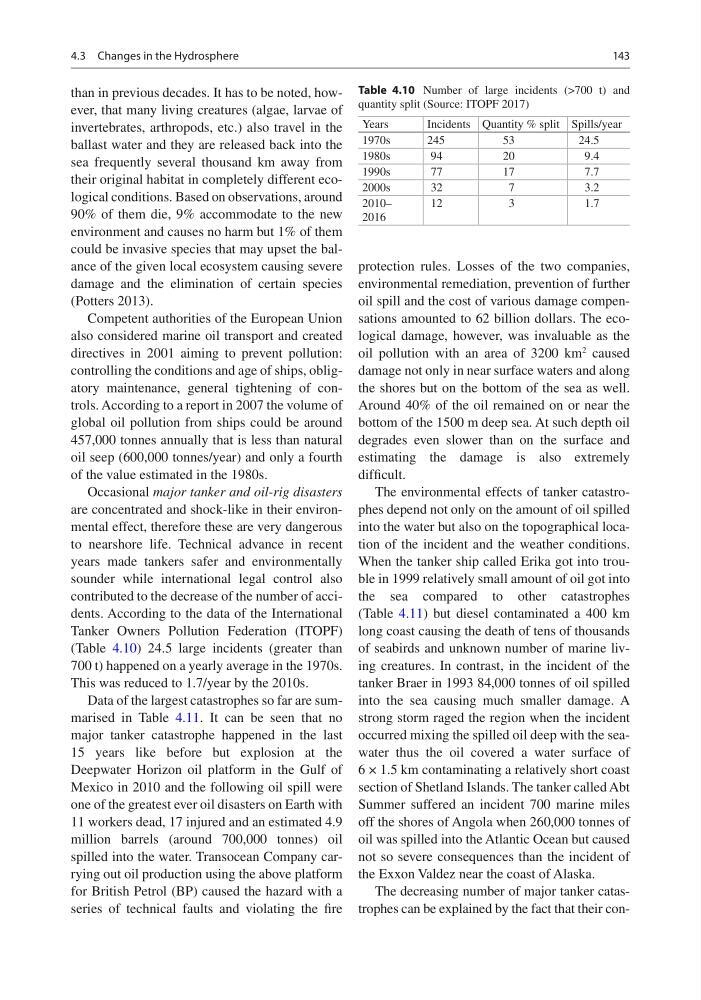
contributed to the decrease of the number of accidents. According to the data of the International
Tanker Owners Pollution Federation (ITOPF)
(Table 4.10) 24.5 large incidents (greater than
700 t) happened on a yearly average in the 1970s.
This was reduced to 1.7/year by the 2010s.
Data of the largest catastrophes so far are summarised in Table 4.11. It can be seen that no
major tanker catastrophe happened in the last
15 years like before but explosion at the
Deepwater Horizon oil platform in the Gulf of
Mexico in 2010 and the following oil spill were
one of the greatest ever oil disasters on Earth with
11 workers dead, 17 injured and an estimated 4.9
million barrels (around 700,000 tonnes) oil
spilled into the water. Transocean Company carrying out oil production using the above platform
for British Petrol (BP) caused the hazard with a
series of technical faults and violating the fire
protection rules. Losses of the two companies,
environmental remediation, prevention of further
oil spill and the cost of various damage compensations amounted to 62 billion dollars. The ecological damage, however, was invaluable as the
oil pollution with an area of 3200 km
2
caused
damage not only in near surface waters and along
the shores but on the bottom of the sea as well.
Around 40% of the oil remained on or near the
bottom of the 1500 m deep sea. At such depth oil
degrades even slower than on the surface and
estimating the damage is also extremely
difficult.
The environmental effects of tanker catastrophes depend not only on the amount of oil spilled
into the water but also on the topographical location of the incident and the weather conditions.
When the tanker ship called Erika got into trouble in 1999 relatively small amount of oil got into
the sea compared to other catastrophes
(Table 4.11) but diesel contaminated a 400 km
long coast causing the death of tens of thousands
of seabirds and unknown number of marine living creatures. In contrast, in the incident of the
tanker Braer in 1993 84,000 tonnes of oil spilled
into the sea causing much smaller damage. A
strong storm raged the region when the incident
occurred mixing the spilled oil deep with the seawater thus the oil covered a water surface of
6 × 1.5 km contaminating a relatively short coast
section of Shetland Islands. The tanker called Abt
Summer suffered an incident 700 marine miles
off the shores of Angola when 260,000 tonnes of
oil was spilled into the Atlantic Ocean but caused
not so severe consequences than the incident of
the Exxon Valdez near the coast of Alaska.
The decreasing number of major tanker catastrophes can be explained by the fact that their conTable 4.10 Number of large incidents (>700 t) and
quantity split (Source: ITOPF 2017)
Years
Incidents Quantity % split Spills/year
1970s
245
53
24.5
1980s
94
20
9.4
1990s
77
17
7.7
2000s
32
7
3.2
2010–
2016
12
3
1.7
4.3 Changes in the Hydrosphere
than in previous decades. It has to be noted, however, that many living creatures (algae, larvae of
invertebrates, arthropods, etc.) also travel in the
ballast water and they are released back into the
sea frequently several thousand km away from
their original habitat in completely different ecological conditions. Based on observations, around
90% of them die, 9% accommodate to the new
environment and causes no harm but 1% of them
could be invasive species that may upset the balance of the given local ecosystem causing severe
damage and the elimination of certain species
(Potters 2013).
Competent authorities of the European Union
also considered marine oil transport and created
directives in 2001 aiming to prevent pollution:
controlling the conditions and age of ships, obligatory maintenance, general tightening of controls. According to a report in 2007 the volume of
global oil pollution from ships could be around
457,000 tonnes annually that is less than natural
oil seep (600,000 tonnes/year) and only a fourth
of the value estimated in the 1980s.
Occasional major tanker and oil-rig disasters
are concentrated and shock-like in their environmental effect, therefore these are very dangerous
to nearshore life. Technical advance in recent
years made tankers safer and environmentally
sounder while international legal control also
contributed to the decrease of the number of accidents. According to the data of the International
Tanker Owners Pollution Federation (ITOPF)
(Table 4.10) 24.5 large incidents (greater than
700 t) happened on a yearly average in the 1970s.
This was reduced to 1.7/year by the 2010s.
Data of the largest catastrophes so far are summarised in Table 4.11. It can be seen that no
major tanker catastrophe happened in the last
15 years like before but explosion at the
Deepwater Horizon oil platform in the Gulf of
Mexico in 2010 and the following oil spill were
one of the greatest ever oil disasters on Earth with
11 workers dead, 17 injured and an estimated 4.9
million barrels (around 700,000 tonnes) oil
spilled into the water. Transocean Company carrying out oil production using the above platform
for British Petrol (BP) caused the hazard with a
series of technical faults and violating the fire
protection rules. Losses of the two companies,
environmental remediation, prevention of further
oil spill and the cost of various damage compensations amounted to 62 billion dollars. The ecological damage, however, was invaluable as the
oil pollution with an area of 3200 km
2
caused
damage not only in near surface waters and along
the shores but on the bottom of the sea as well.
Around 40% of the oil remained on or near the
bottom of the 1500 m deep sea. At such depth oil
degrades even slower than on the surface and
estimating the damage is also extremely
difficult.
The environmental effects of tanker catastrophes depend not only on the amount of oil spilled
into the water but also on the topographical location of the incident and the weather conditions.
When the tanker ship called Erika got into trouble in 1999 relatively small amount of oil got into
the sea compared to other catastrophes
(Table 4.11) but diesel contaminated a 400 km
long coast causing the death of tens of thousands
of seabirds and unknown number of marine living creatures. In contrast, in the incident of the
tanker Braer in 1993 84,000 tonnes of oil spilled
into the sea causing much smaller damage. A
strong storm raged the region when the incident
occurred mixing the spilled oil deep with the seawater thus the oil covered a water surface of
6 × 1.5 km contaminating a relatively short coast
section of Shetland Islands. The tanker called Abt
Summer suffered an incident 700 marine miles
off the shores of Angola when 260,000 tonnes of
oil was spilled into the Atlantic Ocean but caused
not so severe consequences than the incident of
the Exxon Valdez near the coast of Alaska.
The decreasing number of major tanker catastrophes can be explained by the fact that their conTable 4.10 Number of large incidents (>700 t) and
quantity split (Source: ITOPF 2017)
Years
Incidents Quantity % split Spills/year
1970s
245
53
24.5
1980s
94
20
9.4
1990s
77
17
7.7
2000s
32
7
3.2
2010–
2016
12
3
1.7
4.3 Changes in the Hydrosphere