

139
bres are released into the sewage from a single
dress during a single wash (Browne et al. 2011).
Industry also releases a vast amount of microplastics into waters. One study revealed that more
than 1500 tonnes plastic debris is carried by the
Danube into the Black Sea annually, 80% of
which comes from the industry (Lechner et al.
2014). In less industrialised countries the ratio of
industrial pollution is much less and plastics used
in consumption are the main pollution source.
Most plastics either float or hover in the water
as their density in near that of water. Some of
them, however, settle onto the ocean floor.
(Plastic fragments were found even at the bottom
of the Mariana Trench.) Floating microplastics
dominate in the five major plastic islands that are
sometimes also referred to as garbage patches,
plastic soup, ocean landfill or trash vortex.
Since the definition of plastic islands is ambiguous their exact size cannot be given. Consensus
is not achieved in what particle density floatinghovering plastic masses are called plastic island.
Greatest density has been determined in a trash
vortex in the northern part of the Pacific Ocean
with 970,000 fragments/km
2
. (The authors note
that the value could be even more accurate if the
number of fragments would be related to a volume unit.) Smallest concentration has been found
in the plastic island of the southern Pacific Ocean
with the maximum value of 396,000 fragments/
km
2
. Of course sampling influences significantly
the measured values. The referred data were
obtained using samples taken with a net with
330 μm mesh size, a Swedish experiment, however, proved that samples taken using a net with
one magnitude smaller mesh size may yield several magnitude higher fragment numbers (Moore
et al. 2001; Moore 2008; Martinez et al. 2009;
Kershaw et al. 2011; Eriksen et al. 2013).
Measurements also proved that the total mass of
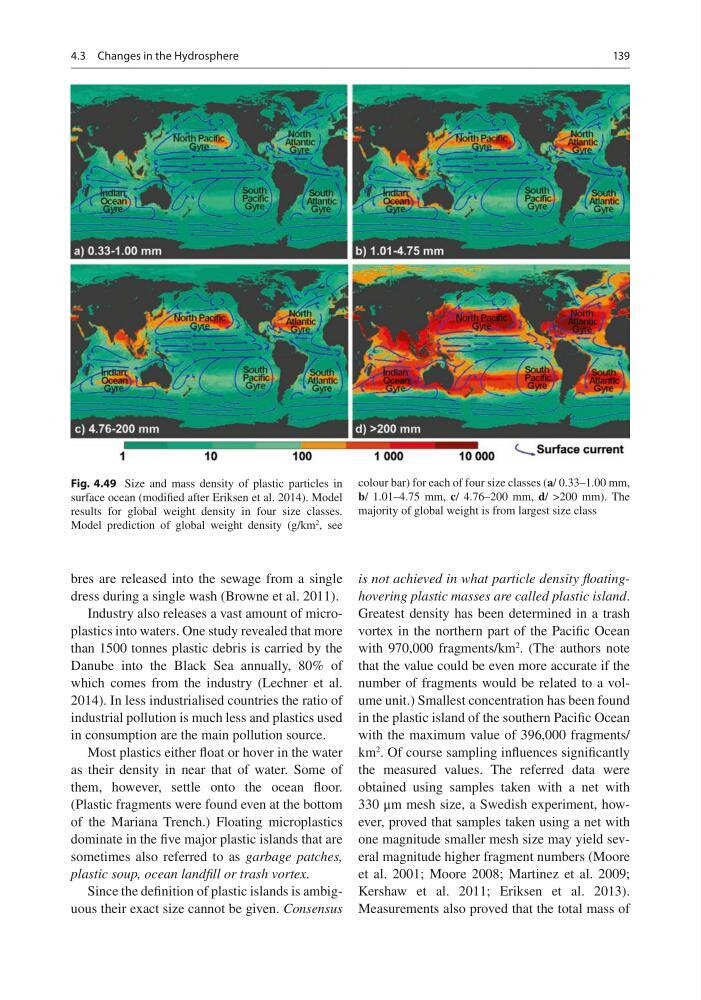
Fig. 4.49 Size and mass density of plastic particles in
surface ocean (modified after Eriksen et al. 2014). Model
results for global weight density in four size classes.
Model prediction of global weight density (g/km
2 , see
colour bar) for each of four size classes (a/ 0.33–1.00 mm,
b/ 1.01–4.75 mm, c/ 4.76–200 mm, d/ >200 mm). The
majority of global weight is from largest size class
4.3 Changes in the Hydrosphere
bres are released into the sewage from a single
dress during a single wash (Browne et al. 2011).
Industry also releases a vast amount of microplastics into waters. One study revealed that more
than 1500 tonnes plastic debris is carried by the
Danube into the Black Sea annually, 80% of
which comes from the industry (Lechner et al.
2014). In less industrialised countries the ratio of
industrial pollution is much less and plastics used
in consumption are the main pollution source.
Most plastics either float or hover in the water
as their density in near that of water. Some of
them, however, settle onto the ocean floor.
(Plastic fragments were found even at the bottom
of the Mariana Trench.) Floating microplastics
dominate in the five major plastic islands that are
sometimes also referred to as garbage patches,
plastic soup, ocean landfill or trash vortex.
Since the definition of plastic islands is ambiguous their exact size cannot be given. Consensus
is not achieved in what particle density floatinghovering plastic masses are called plastic island.
Greatest density has been determined in a trash
vortex in the northern part of the Pacific Ocean
with 970,000 fragments/km
2
. (The authors note
that the value could be even more accurate if the
number of fragments would be related to a volume unit.) Smallest concentration has been found
in the plastic island of the southern Pacific Ocean
with the maximum value of 396,000 fragments/
km
2
. Of course sampling influences significantly
the measured values. The referred data were
obtained using samples taken with a net with
330 μm mesh size, a Swedish experiment, however, proved that samples taken using a net with
one magnitude smaller mesh size may yield several magnitude higher fragment numbers (Moore
et al. 2001; Moore 2008; Martinez et al. 2009;
Kershaw et al. 2011; Eriksen et al. 2013).
Measurements also proved that the total mass of
Fig. 4.49 Size and mass density of plastic particles in
surface ocean (modified after Eriksen et al. 2014). Model
results for global weight density in four size classes.
Model prediction of global weight density (g/km
2 , see
colour bar) for each of four size classes (a/ 0.33–1.00 mm,
b/ 1.01–4.75 mm, c/ 4.76–200 mm, d/ >200 mm). The
majority of global weight is from largest size class
4.3 Changes in the Hydrosphere