

• The endpoints are (1) respiration amount (R) and production amount (P) and
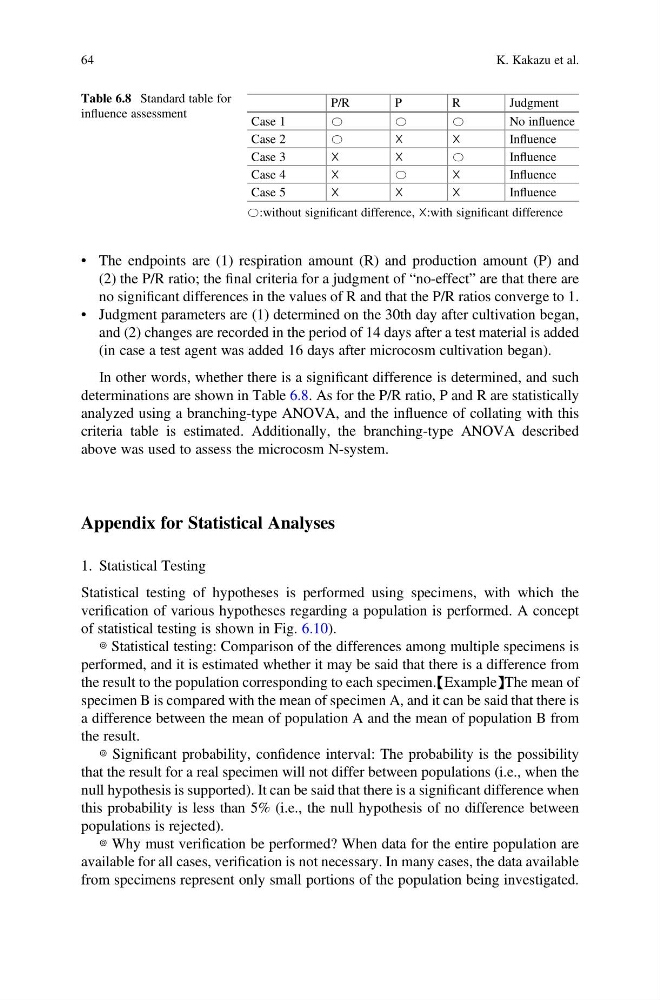
(2) the P/R ratio; the final criteria for a judgment of “no-effect” are that there are
no significant differences in the values of R and that the P/R ratios converge to 1.
• Judgment parameters are (1) determined on the 30th day after cultivation began,
and (2) changes are recorded in the period of 14 days after a test material is added
(in case a test agent was added 16 days after microcosm cultivation began).
In other words, whether there is a significant difference is determined, and such
determinations are shown in Table 6.8. As for the P/R ratio, P and R are statistically
analyzed using a branching-type ANOVA, and the influence of collating with this
criteria table is estimated. Additionally, the branching-type ANOVA described
above was used to assess the microcosm N-system.
Appendix for Statistical Analyses
1. Statistical Testing
Statistical testing of hypotheses is performed using specimens, with which the
verification of various hypotheses regarding a population is performed. A concept
of statistical testing is shown in Fig. 6.10).
◎ Statistical testing: Comparison of the differences among multiple specimens is
performed, and it is estimated whether it may be said that there is a difference from
the result to the population corresponding to each specimen.【Example】The mean of
specimen B is compared with the mean of specimen A, and it can be said that there is
a difference between the mean of population A and the mean of population B from
the result.
◎ Significant probability, confidence interval: The probability is the possibility
that the result for a real specimen will not differ between populations (i.e., when the
null hypothesis is supported). It can be said that there is a significant difference when
this probability is less than 5% (i.e., the null hypothesis of no difference between
populations is rejected).
◎ Why must verification be performed? When data for the entire population are
available for all cases, verification is not necessary. In many cases, the data available
from specimens represent only small portions of the population being investigated.
Table 6.8 Standard table for
influence assessment
P/R
P
R
Judgment
Case 1
〇
〇
〇
No influence
Case 2
〇
☓
☓
Influence
Case 3
☓
☓
〇
Influence
Case 4
☓
〇
☓
Influence
Case 5
☓
☓
☓
Influence
〇:without significant difference, ☓:with significant difference
64
K. Kakazu et al.
(2) the P/R ratio; the final criteria for a judgment of “no-effect” are that there are
no significant differences in the values of R and that the P/R ratios converge to 1.
• Judgment parameters are (1) determined on the 30th day after cultivation began,
and (2) changes are recorded in the period of 14 days after a test material is added
(in case a test agent was added 16 days after microcosm cultivation began).
In other words, whether there is a significant difference is determined, and such
determinations are shown in Table 6.8. As for the P/R ratio, P and R are statistically
analyzed using a branching-type ANOVA, and the influence of collating with this
criteria table is estimated. Additionally, the branching-type ANOVA described
above was used to assess the microcosm N-system.
Appendix for Statistical Analyses
1. Statistical Testing
Statistical testing of hypotheses is performed using specimens, with which the
verification of various hypotheses regarding a population is performed. A concept
of statistical testing is shown in Fig. 6.10).
◎ Statistical testing: Comparison of the differences among multiple specimens is
performed, and it is estimated whether it may be said that there is a difference from
the result to the population corresponding to each specimen.【Example】The mean of
specimen B is compared with the mean of specimen A, and it can be said that there is
a difference between the mean of population A and the mean of population B from
the result.
◎ Significant probability, confidence interval: The probability is the possibility
that the result for a real specimen will not differ between populations (i.e., when the
null hypothesis is supported). It can be said that there is a significant difference when
this probability is less than 5% (i.e., the null hypothesis of no difference between
populations is rejected).
◎ Why must verification be performed? When data for the entire population are
available for all cases, verification is not necessary. In many cases, the data available
from specimens represent only small portions of the population being investigated.
Table 6.8 Standard table for
influence assessment
P/R
P
R
Judgment
Case 1
〇
〇
〇
No influence
Case 2
〇
☓
☓
Influence
Case 3
☓
☓
〇
Influence
Case 4
☓
〇
☓
Influence
Case 5
☓
☓
☓
Influence
〇:without significant difference, ☓:with significant difference
64
K. Kakazu et al.