

Philodina erythrophthalma, respectively. The dry weight of Aeolosoma hemprichi
was estimated from length and width measurements (n ¼ 20) according to the
method of Andrassy (1956) as cited by McIntyre (1969):
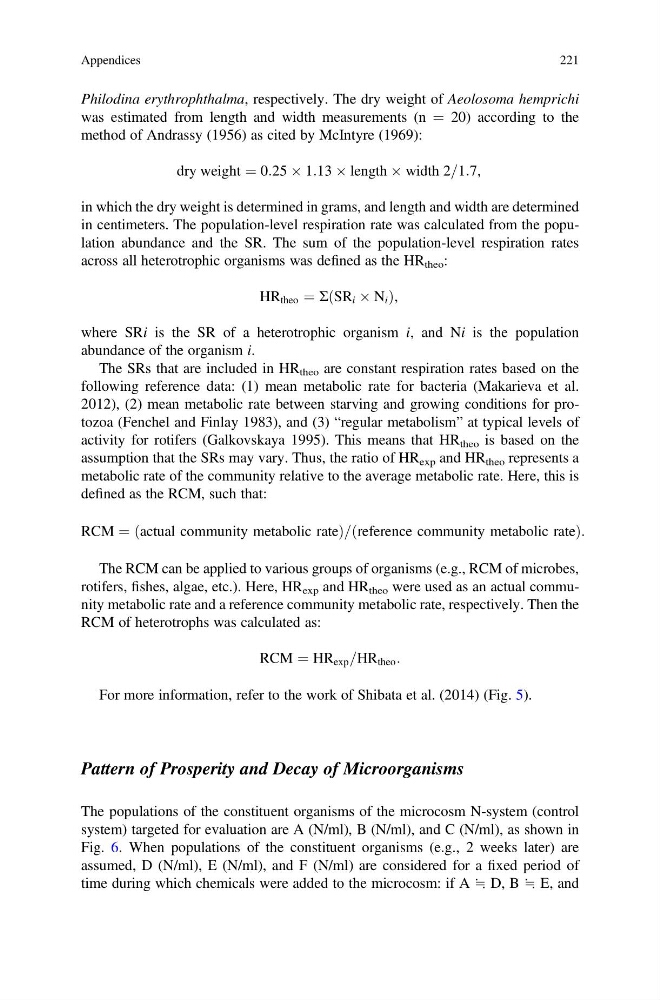
dry weight ¼ 0:25  1:13  length  width 2=1:7,
in which the dry weight is determined in grams, and length and width are determined
in centimeters. The population-level respiration rate was calculated from the population abundance and the SR. The sum of the population-level respiration rates
across all heterotrophic organisms was defined as the HR theo :
HR theo ¼ Σ SR i  N i
ð
Þ ,
where SRi is the SR of a heterotrophic organism i, and Ni is the population
abundance of the organism i.
The SRs that are included in HR theo are constant respiration rates based on the
following reference data: (1) mean metabolic rate for bacteria (Makarieva et al.
2012), (2) mean metabolic rate between starving and growing conditions for protozoa (Fenchel and Finlay 1983), and (3) “regular metabolism” at typical levels of
activity for rotifers (Galkovskaya 1995). This means that HR theo is based on the
assumption that the SRs may vary. Thus, the ratio of HR exp and HR theo represents a
metabolic rate of the community relative to the average metabolic rate. Here, this is
defined as the RCM, such that:
RCM ¼ actual community metabolic rate
ð
Þ = reference community metabolic rate
ð
Þ :
The RCM can be applied to various groups of organisms (e.g., RCM of microbes,
rotifers, fishes, algae, etc.). Here, HR exp and HR theo were used as an actual community metabolic rate and a reference community metabolic rate, respectively. Then the
RCM of heterotrophs was calculated as:
RCM ¼ HR exp =HR theo :
For more information, refer to the work of Shibata et al. (2014) (Fig. 5).
Pattern of Prosperity and Decay of Microorganisms
The populations of the constituent organisms of the microcosm N-system (control
system) targeted for evaluation are A (N/ml), B (N/ml), and C (N/ml), as shown in
Fig. 6. When populations of the constituent organisms (e.g., 2 weeks later) are
assumed, D (N/ml), E (N/ml), and F (N/ml) are considered for a fixed period of
time during which chemicals were added to the microcosm: if A ≒ D, B ≒ E, and
Appendices
221
was estimated from length and width measurements (n ¼ 20) according to the
method of Andrassy (1956) as cited by McIntyre (1969):
dry weight ¼ 0:25  1:13  length  width 2=1:7,
in which the dry weight is determined in grams, and length and width are determined
in centimeters. The population-level respiration rate was calculated from the population abundance and the SR. The sum of the population-level respiration rates
across all heterotrophic organisms was defined as the HR theo :
HR theo ¼ Σ SR i  N i
ð
Þ ,
where SRi is the SR of a heterotrophic organism i, and Ni is the population
abundance of the organism i.
The SRs that are included in HR theo are constant respiration rates based on the
following reference data: (1) mean metabolic rate for bacteria (Makarieva et al.
2012), (2) mean metabolic rate between starving and growing conditions for protozoa (Fenchel and Finlay 1983), and (3) “regular metabolism” at typical levels of
activity for rotifers (Galkovskaya 1995). This means that HR theo is based on the
assumption that the SRs may vary. Thus, the ratio of HR exp and HR theo represents a
metabolic rate of the community relative to the average metabolic rate. Here, this is
defined as the RCM, such that:
RCM ¼ actual community metabolic rate
ð
Þ = reference community metabolic rate
ð
Þ :
The RCM can be applied to various groups of organisms (e.g., RCM of microbes,
rotifers, fishes, algae, etc.). Here, HR exp and HR theo were used as an actual community metabolic rate and a reference community metabolic rate, respectively. Then the
RCM of heterotrophs was calculated as:
RCM ¼ HR exp =HR theo :
For more information, refer to the work of Shibata et al. (2014) (Fig. 5).
Pattern of Prosperity and Decay of Microorganisms
The populations of the constituent organisms of the microcosm N-system (control
system) targeted for evaluation are A (N/ml), B (N/ml), and C (N/ml), as shown in
Fig. 6. When populations of the constituent organisms (e.g., 2 weeks later) are
assumed, D (N/ml), E (N/ml), and F (N/ml) are considered for a fixed period of
time during which chemicals were added to the microcosm: if A ≒ D, B ≒ E, and
Appendices
221