

comparison with the control system (no-addition system) 30 days after the
culture began.
(3) Evaluate the abundance of constituent organisms after the addition of the
chemical substance (B 16–30 ). Evaluate the abundances of constituent microbes
for each 14-day addition, in comparison with the control system (non-addition
system). Calculate abundance graphically using the following equation (1), with
the quantity of existence (area population density):
abundance ¼
X
population N 1 þ population N 2
ð
Þ =2 Â days days
ð
Þ
f
g
½
ð 1Þ
Additionally, a more detailed evaluation and analysis is enabled by comparing the
functional parameters (DO and P/R ratio) with the structural parameters (abundance
and biomass).
Influence and Assessment Method
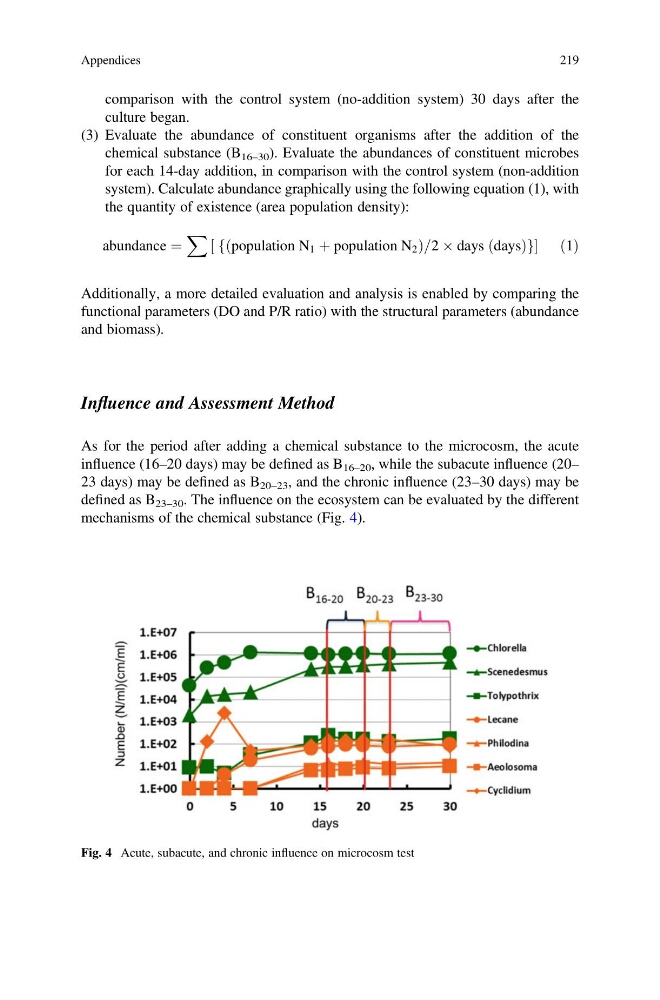
As for the period after adding a chemical substance to the microcosm, the acute
influence (16–20 days) may be defined as B 16–20 , while the subacute influence (20–
23 days) may be defined as B 20–23 , and the chronic influence (23–30 days) may be
defined as B 23–30 . The influence on the ecosystem can be evaluated by the different
mechanisms of the chemical substance (Fig. 4).
Fig. 4 Acute, subacute, and chronic influence on microcosm test
Appendices
219
culture began.
(3) Evaluate the abundance of constituent organisms after the addition of the
chemical substance (B 16–30 ). Evaluate the abundances of constituent microbes
for each 14-day addition, in comparison with the control system (non-addition
system). Calculate abundance graphically using the following equation (1), with
the quantity of existence (area population density):
abundance ¼
X
population N 1 þ population N 2
ð
Þ =2 Â days days
ð
Þ
f
g
½
ð 1Þ
Additionally, a more detailed evaluation and analysis is enabled by comparing the
functional parameters (DO and P/R ratio) with the structural parameters (abundance
and biomass).
Influence and Assessment Method
As for the period after adding a chemical substance to the microcosm, the acute
influence (16–20 days) may be defined as B 16–20 , while the subacute influence (20–
23 days) may be defined as B 20–23 , and the chronic influence (23–30 days) may be
defined as B 23–30 . The influence on the ecosystem can be evaluated by the different
mechanisms of the chemical substance (Fig. 4).
Fig. 4 Acute, subacute, and chronic influence on microcosm test
Appendices
219