

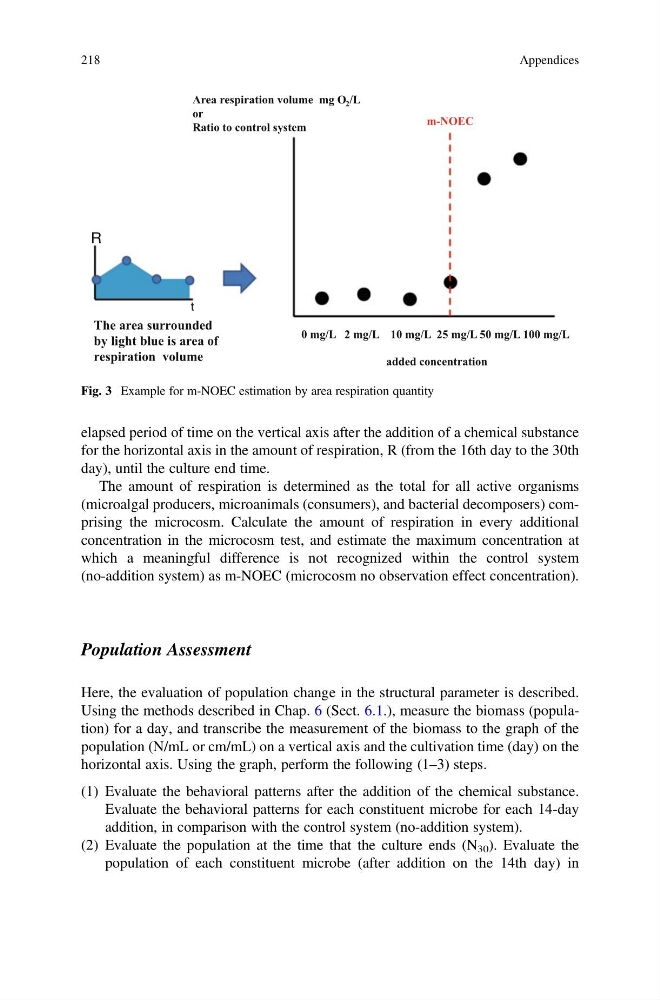
elapsed period of time on the vertical axis after the addition of a chemical substance
for the horizontal axis in the amount of respiration, R (from the 16th day to the 30th
day), until the culture end time.
The amount of respiration is determined as the total for all active organisms
(microalgal producers, microanimals (consumers), and bacterial decomposers) comprising the microcosm. Calculate the amount of respiration in every additional
concentration in the microcosm test, and estimate the maximum concentration at
which a meaningful difference is not recognized within the control system
(no-addition system) as m-NOEC (microcosm no observation effect concentration).
Population Assessment
Here, the evaluation of population change in the structural parameter is described.
Using the methods described in Chap. 6 (Sect. 6.1.), measure the biomass (population) for a day, and transcribe the measurement of the biomass to the graph of the
population (N/mL or cm/mL) on a vertical axis and the cultivation time (day) on the
horizontal axis. Using the graph, perform the following (1–3) steps.
(1) Evaluate the behavioral patterns after the addition of the chemical substance.
Evaluate the behavioral patterns for each constituent microbe for each 14-day
addition, in comparison with the control system (no-addition system).
(2) Evaluate the population at the time that the culture ends (N 30 ). Evaluate the
population of each constituent microbe (after addition on the 14th day) in
Area respiration volume mg O 2 /L
or
Ratio to control system
m-NOEC
The area surrounded
by light blue is area of
respiration volume
0 mg/L 2 mg/L 10 mg/L 25 mg/L 50 mg/L 100 mg/L
added concentration
R
t
Fig. 3 Example for m-NOEC estimation by area respiration quantity
218
Appendices
for the horizontal axis in the amount of respiration, R (from the 16th day to the 30th
day), until the culture end time.
The amount of respiration is determined as the total for all active organisms
(microalgal producers, microanimals (consumers), and bacterial decomposers) comprising the microcosm. Calculate the amount of respiration in every additional
concentration in the microcosm test, and estimate the maximum concentration at
which a meaningful difference is not recognized within the control system
(no-addition system) as m-NOEC (microcosm no observation effect concentration).
Population Assessment
Here, the evaluation of population change in the structural parameter is described.
Using the methods described in Chap. 6 (Sect. 6.1.), measure the biomass (population) for a day, and transcribe the measurement of the biomass to the graph of the
population (N/mL or cm/mL) on a vertical axis and the cultivation time (day) on the
horizontal axis. Using the graph, perform the following (1–3) steps.
(1) Evaluate the behavioral patterns after the addition of the chemical substance.
Evaluate the behavioral patterns for each constituent microbe for each 14-day
addition, in comparison with the control system (no-addition system).
(2) Evaluate the population at the time that the culture ends (N 30 ). Evaluate the
population of each constituent microbe (after addition on the 14th day) in
Area respiration volume mg O 2 /L
or
Ratio to control system
m-NOEC
The area surrounded
by light blue is area of
respiration volume
0 mg/L 2 mg/L 10 mg/L 25 mg/L 50 mg/L 100 mg/L
added concentration
R
t
Fig. 3 Example for m-NOEC estimation by area respiration quantity
218
Appendices