

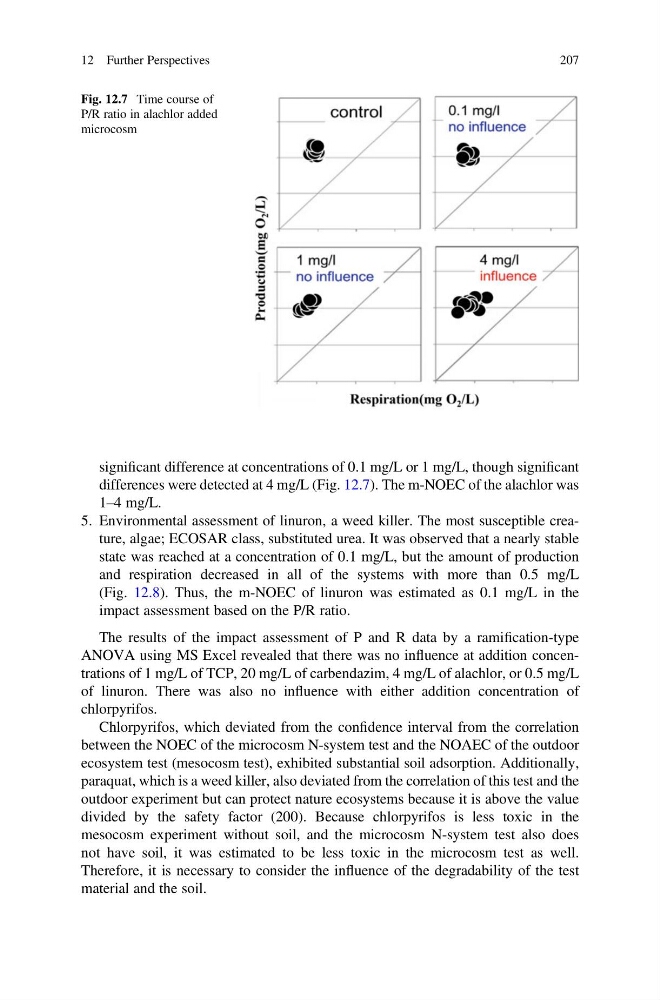
significant difference at concentrations of 0.1 mg/L or 1 mg/L, though significant
differences were detected at 4 mg/L (Fig. 12.7). The m-NOEC of the alachlor was
1–4 mg/L.
5. Environmental assessment of linuron, a weed killer. The most susceptible creature, algae; ECOSAR class, substituted urea. It was observed that a nearly stable
state was reached at a concentration of 0.1 mg/L, but the amount of production
and respiration decreased in all of the systems with more than 0.5 mg/L
(Fig. 12.8). Thus, the m-NOEC of linuron was estimated as 0.1 mg/L in the
impact assessment based on the P/R ratio.
The results of the impact assessment of P and R data by a ramification-type
ANOVA using MS Excel revealed that there was no influence at addition concentrations of 1 mg/L of TCP, 20 mg/L of carbendazim, 4 mg/L of alachlor, or 0.5 mg/L
of linuron. There was also no influence with either addition concentration of
chlorpyrifos.
Chlorpyrifos, which deviated from the confidence interval from the correlation
between the NOEC of the microcosm N-system test and the NOAEC of the outdoor
ecosystem test (mesocosm test), exhibited substantial soil adsorption. Additionally,
paraquat, which is a weed killer, also deviated from the correlation of this test and the
outdoor experiment but can protect nature ecosystems because it is above the value
divided by the safety factor (200). Because chlorpyrifos is less toxic in the
mesocosm experiment without soil, and the microcosm N-system test also does
not have soil, it was estimated to be less toxic in the microcosm test as well.
Therefore, it is necessary to consider the influence of the degradability of the test
material and the soil.
Fig. 12.7 Time course of
P/R ratio in alachlor added
microcosm
12 Further Perspectives
207
differences were detected at 4 mg/L (Fig. 12.7). The m-NOEC of the alachlor was
1–4 mg/L.
5. Environmental assessment of linuron, a weed killer. The most susceptible creature, algae; ECOSAR class, substituted urea. It was observed that a nearly stable
state was reached at a concentration of 0.1 mg/L, but the amount of production
and respiration decreased in all of the systems with more than 0.5 mg/L
(Fig. 12.8). Thus, the m-NOEC of linuron was estimated as 0.1 mg/L in the
impact assessment based on the P/R ratio.
The results of the impact assessment of P and R data by a ramification-type
ANOVA using MS Excel revealed that there was no influence at addition concentrations of 1 mg/L of TCP, 20 mg/L of carbendazim, 4 mg/L of alachlor, or 0.5 mg/L
of linuron. There was also no influence with either addition concentration of
chlorpyrifos.
Chlorpyrifos, which deviated from the confidence interval from the correlation
between the NOEC of the microcosm N-system test and the NOAEC of the outdoor
ecosystem test (mesocosm test), exhibited substantial soil adsorption. Additionally,
paraquat, which is a weed killer, also deviated from the correlation of this test and the
outdoor experiment but can protect nature ecosystems because it is above the value
divided by the safety factor (200). Because chlorpyrifos is less toxic in the
mesocosm experiment without soil, and the microcosm N-system test also does
not have soil, it was estimated to be less toxic in the microcosm test as well.
Therefore, it is necessary to consider the influence of the degradability of the test
material and the soil.
Fig. 12.7 Time course of
P/R ratio in alachlor added
microcosm
12 Further Perspectives
207