

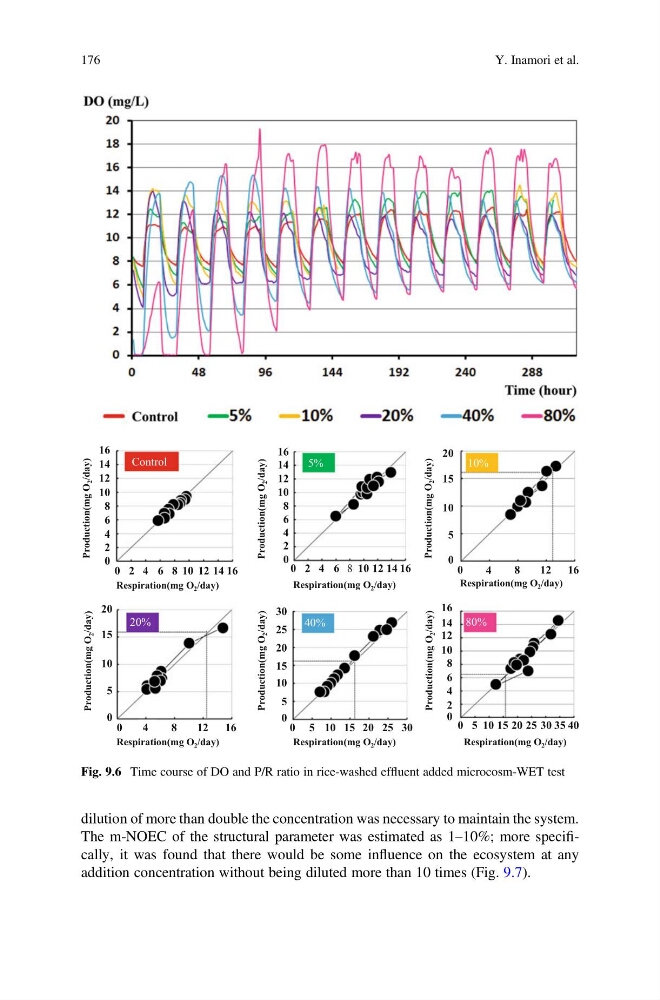
dilution of more than double the concentration was necessary to maintain the system.
The m-NOEC of the structural parameter was estimated as 1–10%; more specifically, it was found that there would be some influence on the ecosystem at any
addition concentration without being diluted more than 10 times (Fig. 9.7).
10%
20%
80%
40%
Control
5%
Respiration(mg O 2 /day)
Respiration(mg O 2 /day)
Respiration(mg O 2 /day)
Respiration(mg O 2 /day)
Respiration(mg O 2 /day)
16
14
12
10
8
6
4
2
0
0 2 4 6 8 10
16
12 14
0 2 4 6 8 10
16
12 14
16
14
12
10
8
6
4
2
0
Production(mg O
2 /day)
O
g
m
(
n
o
i
t
c
u
d
o
r
P
2
)
y
a
d
/
20
15
10
5
0
Production(mg O
2 /day)
20
15
10
5
0
O
g
m
(
n
o
i
t
c
u
d
o
r
P
2
)
y
a
d
/
30
25
20
15
10
5
0
Production(mg O
2 /day)
0
4
8
16
12
Respiration(mg O 2 /day)
0
4
8
1 6
12
0 5 10 15 20 25 30
5
15
10
20 25 30 35 40
0
16
12
14
8
10
4
6
2
0
Production(mg O
2 /day)
Fig. 9.6 Time course of DO and P/R ratio in rice-washed effluent added microcosm-WET test
176
Y. Inamori et al.
The m-NOEC of the structural parameter was estimated as 1–10%; more specifically, it was found that there would be some influence on the ecosystem at any
addition concentration without being diluted more than 10 times (Fig. 9.7).
10%
20%
80%
40%
Control
5%
Respiration(mg O 2 /day)
Respiration(mg O 2 /day)
Respiration(mg O 2 /day)
Respiration(mg O 2 /day)
Respiration(mg O 2 /day)
16
14
12
10
8
6
4
2
0
0 2 4 6 8 10
16
12 14
0 2 4 6 8 10
16
12 14
16
14
12
10
8
6
4
2
0
Production(mg O
2 /day)
O
g
m
(
n
o
i
t
c
u
d
o
r
P
2
)
y
a
d
/
20
15
10
5
0
Production(mg O
2 /day)
20
15
10
5
0
O
g
m
(
n
o
i
t
c
u
d
o
r
P
2
)
y
a
d
/
30
25
20
15
10
5
0
Production(mg O
2 /day)
0
4
8
16
12
Respiration(mg O 2 /day)
0
4
8
1 6
12
0 5 10 15 20 25 30
5
15
10
20 25 30 35 40
0
16
12
14
8
10
4
6
2
0
Production(mg O
2 /day)
Fig. 9.6 Time course of DO and P/R ratio in rice-washed effluent added microcosm-WET test
176
Y. Inamori et al.