

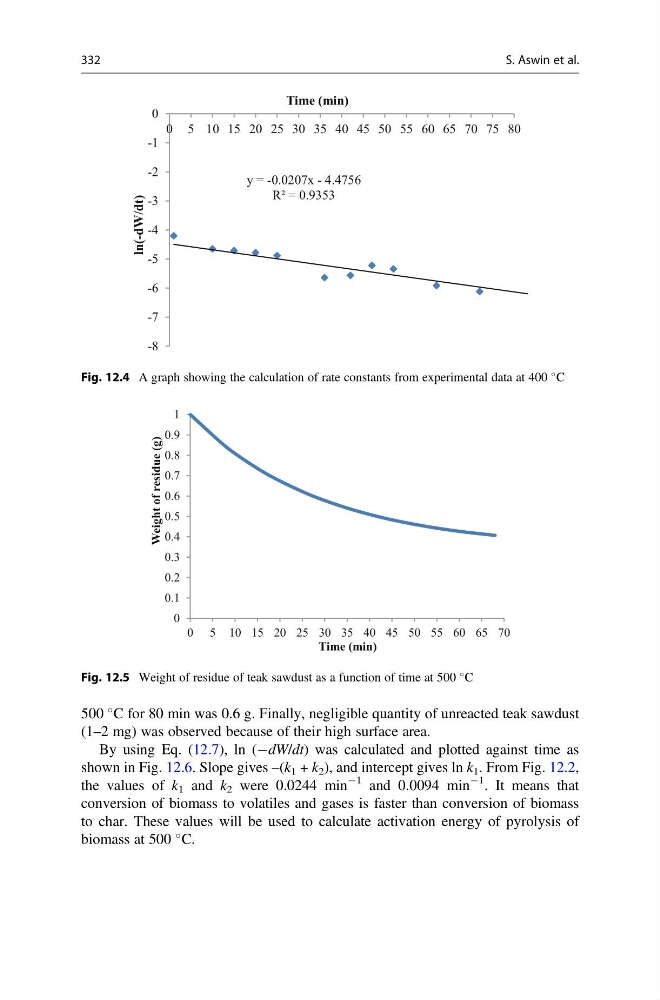
500
C for 80 min was 0.6 g. Finally, negligible quantity of unreacted teak sawdust
(1–2 mg) was observed because of their high surface area.
By using Eq. (12.7), ln (ÀdW/dt) was calculated and plotted against time as
shown in Fig. 12.6. Slope gives –(k 1 + k 2 ), and intercept gives ln k 1 . From Fig. 12.2,
the values of k 1 and k 2 were 0.0244 min
À1 and 0.0094 min
À1 . It means that
conversion of biomass to volatiles and gases is faster than conversion of biomass
to char. These values will be used to calculate activation energy of pyrolysis of
biomass at 500
C.
y = -0.0207x - 4.4756
R² = 0.9353
-8
-7
-6
-5
-4
-3
-2
-1
0
0 5 10 15 20 25 30 35 40 45 50 55 60 65 70 75 80
ln(-dW/dt)
Time (min)
Fig. 12.4 A graph showing the calculation of rate constants from experimental data at 400
C
0
0.1
0.2
0.3
0.4
0.5
0.6
0.7
0.8
0.9
1
0 5 10 15 20 25 30 35 40 45 50 55 60 65 70
)
g
(
e
u
d
i
s
e
r
f
o
t
h
g
i
e
W
Time (min)
Fig. 12.5 Weight of residue of teak sawdust as a function of time at 500
C
332
S. Aswin et al.
C for 80 min was 0.6 g. Finally, negligible quantity of unreacted teak sawdust
(1–2 mg) was observed because of their high surface area.
By using Eq. (12.7), ln (ÀdW/dt) was calculated and plotted against time as
shown in Fig. 12.6. Slope gives –(k 1 + k 2 ), and intercept gives ln k 1 . From Fig. 12.2,
the values of k 1 and k 2 were 0.0244 min
À1 and 0.0094 min
À1 . It means that
conversion of biomass to volatiles and gases is faster than conversion of biomass
to char. These values will be used to calculate activation energy of pyrolysis of
biomass at 500
C.
y = -0.0207x - 4.4756
R² = 0.9353
-8
-7
-6
-5
-4
-3
-2
-1
0
0 5 10 15 20 25 30 35 40 45 50 55 60 65 70 75 80
ln(-dW/dt)
Time (min)
Fig. 12.4 A graph showing the calculation of rate constants from experimental data at 400
C
0
0.1
0.2
0.3
0.4
0.5
0.6
0.7
0.8
0.9
1
0 5 10 15 20 25 30 35 40 45 50 55 60 65 70
)
g
(
e
u
d
i
s
e
r
f
o
t
h
g
i
e
W
Time (min)
Fig. 12.5 Weight of residue of teak sawdust as a function of time at 500
C
332
S. Aswin et al.