

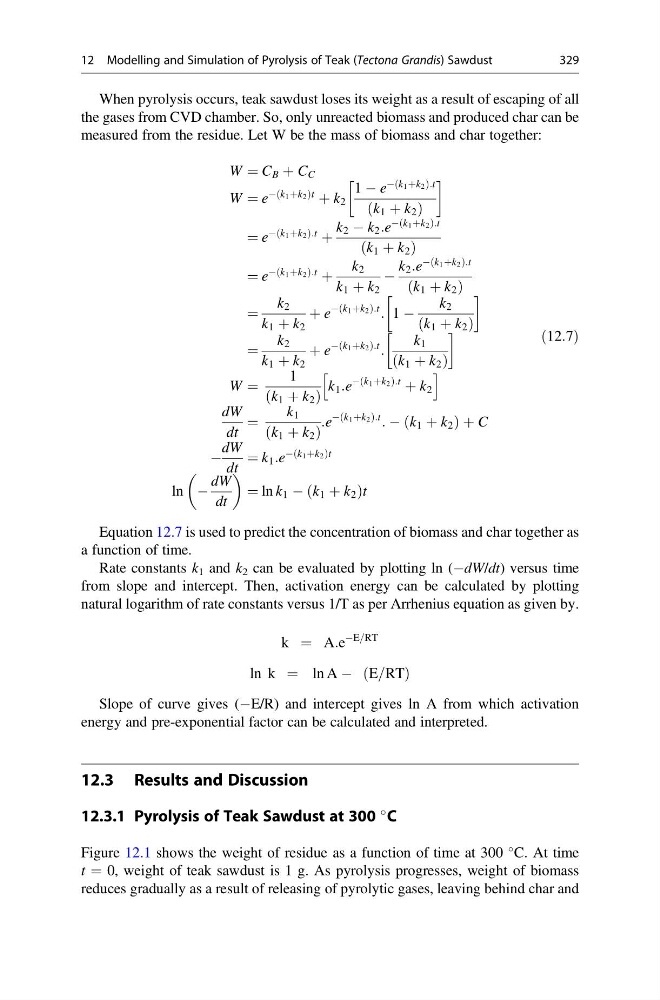
When pyrolysis occurs, teak sawdust loses its weight as a result of escaping of all
the gases from CVD chamber. So, only unreacted biomass and produced char can be
measured from the residue. Let W be the mass of biomass and char together:
W ¼ C B þ C C
W ¼ e
À k 1 þk 2
ð
Þ t
þ k 2
1 À e
À k 1 þk 2
ð
Þ :t
k 1 þ k 2
ð
Þ
!
¼ e
À k 1 þk 2
ð
Þ :t
þ
k 2 À k 2 :e
À k 1 þk 2
ð
Þ :t
k 1 þ k 2
ð
Þ
¼ e
À k 1 þk 2
ð
Þ :t
þ
k 2
k 1 þ k 2
À
k 2 :e
À k 1 þk 2
ð
Þ :t
k 1 þ k 2
ð
Þ
¼
k 2
k 1 þ k 2
þ e
À k 1 þk 2
ð
Þ :t
: 1 À
k 2
k 1 þ k 2
ð
Þ
!
¼
k 2
k 1 þ k 2
þ e
À k 1 þk 2
ð
Þ :t
:
k 1
k 1 þ k 2
ð
Þ
!
W ¼
1
k 1 þ k 2
ð
Þ
k 1 :e
À k 1 þk 2
ð
Þ :t
þ k 2
h
i
dW
dt
¼
k 1
k 1 þ k 2
ð
Þ
:e
À k 1 þk 2
ð
Þ :t
: À k 1 þ k 2
ð
ÞþC
À
dW
dt
¼ k 1 :e
À k 1 þk 2
ð
Þ t
ln À
dW
dt
¼ ln k 1 À k 1 þ k 2
ð
Þt
ð12:7Þ
Equation 12.7 is used to predict the concentration of biomass and char together as
a function of time.
Rate constants k 1 and k 2 can be evaluated by plotting ln (ÀdW/dt) versus time
from slope and intercept. Then, activation energy can be calculated by plotting
natural logarithm of rate constants versus 1/T as per Arrhenius equation as given by.
k ¼ A:e
ÀE=RT
ln k ¼ ln A À E=RT
ð
Þ
Slope of curve gives (ÀE/R) and intercept gives ln A from which activation
energy and pre-exponential factor can be calculated and interpreted.
12.3 Results and Discussion
12.3.1 Pyrolysis of Teak Sawdust at 300
C
Figure 12.1 shows the weight of residue as a function of time at 300
C. At time
t ¼ 0, weight of teak sawdust is 1 g. As pyrolysis progresses, weight of biomass
reduces gradually as a result of releasing of pyrolytic gases, leaving behind char and
12 Modelling and Simulation of Pyrolysis of Teak (Tectona Grandis) Sawdust
329
the gases from CVD chamber. So, only unreacted biomass and produced char can be
measured from the residue. Let W be the mass of biomass and char together:
W ¼ C B þ C C
W ¼ e
À k 1 þk 2
ð
Þ t
þ k 2
1 À e
À k 1 þk 2
ð
Þ :t
k 1 þ k 2
ð
Þ
!
¼ e
À k 1 þk 2
ð
Þ :t
þ
k 2 À k 2 :e
À k 1 þk 2
ð
Þ :t
k 1 þ k 2
ð
Þ
¼ e
À k 1 þk 2
ð
Þ :t
þ
k 2
k 1 þ k 2
À
k 2 :e
À k 1 þk 2
ð
Þ :t
k 1 þ k 2
ð
Þ
¼
k 2
k 1 þ k 2
þ e
À k 1 þk 2
ð
Þ :t
: 1 À
k 2
k 1 þ k 2
ð
Þ
!
¼
k 2
k 1 þ k 2
þ e
À k 1 þk 2
ð
Þ :t
:
k 1
k 1 þ k 2
ð
Þ
!
W ¼
1
k 1 þ k 2
ð
Þ
k 1 :e
À k 1 þk 2
ð
Þ :t
þ k 2
h
i
dW
dt
¼
k 1
k 1 þ k 2
ð
Þ
:e
À k 1 þk 2
ð
Þ :t
: À k 1 þ k 2
ð
ÞþC
À
dW
dt
¼ k 1 :e
À k 1 þk 2
ð
Þ t
ln À
dW
dt
¼ ln k 1 À k 1 þ k 2
ð
Þt
ð12:7Þ
Equation 12.7 is used to predict the concentration of biomass and char together as
a function of time.
Rate constants k 1 and k 2 can be evaluated by plotting ln (ÀdW/dt) versus time
from slope and intercept. Then, activation energy can be calculated by plotting
natural logarithm of rate constants versus 1/T as per Arrhenius equation as given by.
k ¼ A:e
ÀE=RT
ln k ¼ ln A À E=RT
ð
Þ
Slope of curve gives (ÀE/R) and intercept gives ln A from which activation
energy and pre-exponential factor can be calculated and interpreted.
12.3 Results and Discussion
12.3.1 Pyrolysis of Teak Sawdust at 300
C
Figure 12.1 shows the weight of residue as a function of time at 300
C. At time
t ¼ 0, weight of teak sawdust is 1 g. As pyrolysis progresses, weight of biomass
reduces gradually as a result of releasing of pyrolytic gases, leaving behind char and
12 Modelling and Simulation of Pyrolysis of Teak (Tectona Grandis) Sawdust
329