

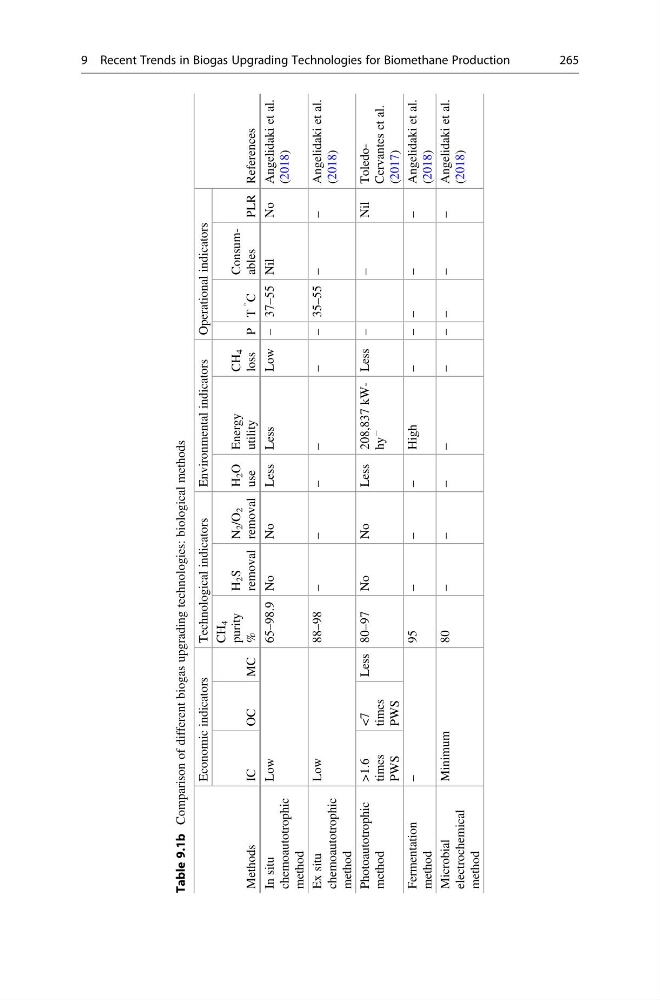
Table 9.1b
Comparison of different biogas upgrading technologies: biological methods
Methods
Economic indicators
Technological indicators
Environmental indicators
Operational indicators
References
IC
OC
MC
CH
4
purity
%
H
2 S
removal
N
2 /O
2
removal
H
2 O
use
Energy
utility
CH
4
loss P T
C
Consumables
PLR
In situ
chemoautotrophic
method
Low
65–98.9 No
No
Less Less
Low
– 37–55 Nil
No Angelidaki et al.
(2018)
Ex situ
chemoautotrophic
method
Low
88–98
–
–
–
–
–
– 35–55
–
–
Angelidaki et al.
(2018)
Photoautotrophic
method
>1.6
times
PWS
<7
times
PWS
Less 80–97
No
No
Less 208,837 kWhy
À
Less
–
–
Nil ToledoCervantes et al.
(2017)
Fermentation
method
–
95
–
–
–
High
–
– –
–
–
Angelidaki et al.
(2018)
Microbial
electrochemical
method
Minimum
80
–
–
–
–
–
– –
–
–
Angelidaki et al.
(2018)
9 Recent Trends in Biogas Upgrading Technologies for Biomethane Production
265
Comparison of different biogas upgrading technologies: biological methods
Methods
Economic indicators
Technological indicators
Environmental indicators
Operational indicators
References
IC
OC
MC
CH
4
purity
%
H
2 S
removal
N
2 /O
2
removal
H
2 O
use
Energy
utility
CH
4
loss P T
C
Consumables
PLR
In situ
chemoautotrophic
method
Low
65–98.9 No
No
Less Less
Low
– 37–55 Nil
No Angelidaki et al.
(2018)
Ex situ
chemoautotrophic
method
Low
88–98
–
–
–
–
–
– 35–55
–
–
Angelidaki et al.
(2018)
Photoautotrophic
method
>1.6
times
PWS
<7
times
PWS
Less 80–97
No
No
Less 208,837 kWhy
À
Less
–
–
Nil ToledoCervantes et al.
(2017)
Fermentation
method
–
95
–
–
–
High
–
– –
–
–
Angelidaki et al.
(2018)
Microbial
electrochemical
method
Minimum
80
–
–
–
–
–
– –
–
–
Angelidaki et al.
(2018)
9 Recent Trends in Biogas Upgrading Technologies for Biomethane Production
265