

80
J. A. R. Plata et al.
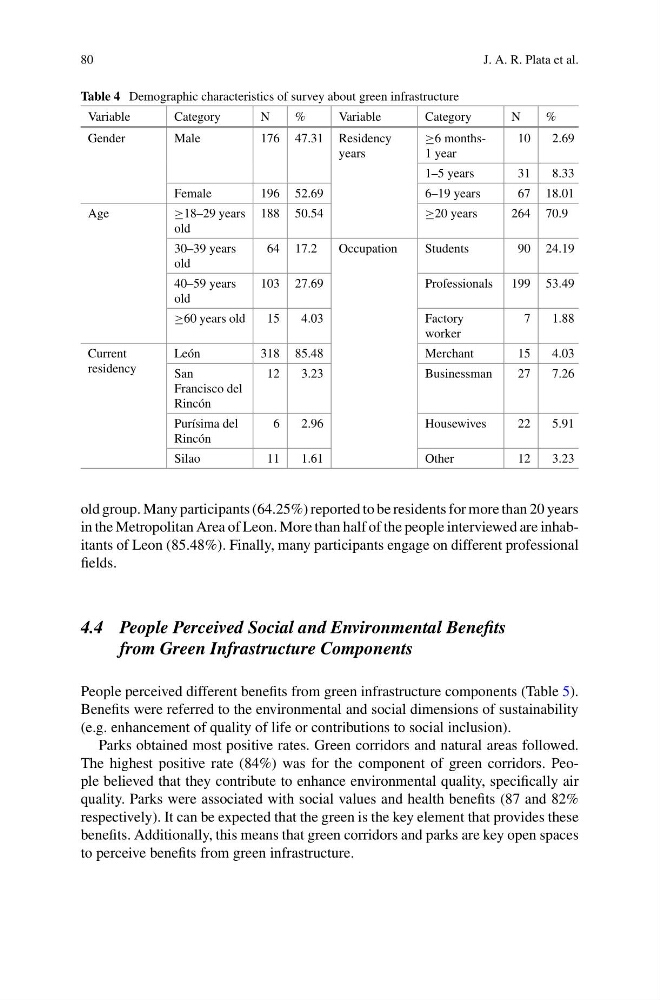
Table 4 Demographic characteristics of survey about green infrastructure
Variable
Category
N
%
Variable
Category
N
%
Gender
Male
176 47.31 Residency
years
≥6 months1 year
10
2.69
1–5 years
31
8.33
Female
196 52.69
6–19 years
67 18.01
Age
≥18–29 years
old
188 50.54
≥20 years
264 70.9
30–39 years
old
64 17.2
Occupation
Students
90 24.19
40–59 years
old
103 27.69
Professionals 199 53.49
≥60 years old
15
4.03
Factory
worker
7
1.88
Current
residency
León
318 85.48
Merchant
15
4.03
San
Francisco del
Rincón
12
3.23
Businessman
27
7.26
Purísima del
Rincón
6
2.96
Housewives
22
5.91
Silao
11
1.61
Other
12
3.23
old group. Many participants (64.25%) reported to be residents for more than 20 years
in the Metropolitan Area of Leon. More than half of the people interviewed are inhabitants of Leon (85.48%). Finally, many participants engage on different professional
fields.
4.4 People Perceived Social and Environmental Benefits
from Green Infrastructure Components
People perceived different benefits from green infrastructure components (Table 5).
Benefits were referred to the environmental and social dimensions of sustainability
(e.g. enhancement of quality of life or contributions to social inclusion).
Parks obtained most positive rates. Green corridors and natural areas followed.
The highest positive rate (84%) was for the component of green corridors. People believed that they contribute to enhance environmental quality, specifically air
quality. Parks were associated with social values and health benefits (87 and 82%
respectively). It can be expected that the green is the key element that provides these
benefits. Additionally, this means that green corridors and parks are key open spaces
to perceive benefits from green infrastructure.
J. A. R. Plata et al.
Table 4 Demographic characteristics of survey about green infrastructure
Variable
Category
N
%
Variable
Category
N
%
Gender
Male
176 47.31 Residency
years
≥6 months1 year
10
2.69
1–5 years
31
8.33
Female
196 52.69
6–19 years
67 18.01
Age
≥18–29 years
old
188 50.54
≥20 years
264 70.9
30–39 years
old
64 17.2
Occupation
Students
90 24.19
40–59 years
old
103 27.69
Professionals 199 53.49
≥60 years old
15
4.03
Factory
worker
7
1.88
Current
residency
León
318 85.48
Merchant
15
4.03
San
Francisco del
Rincón
12
3.23
Businessman
27
7.26
Purísima del
Rincón
6
2.96
Housewives
22
5.91
Silao
11
1.61
Other
12
3.23
old group. Many participants (64.25%) reported to be residents for more than 20 years
in the Metropolitan Area of Leon. More than half of the people interviewed are inhabitants of Leon (85.48%). Finally, many participants engage on different professional
fields.
4.4 People Perceived Social and Environmental Benefits
from Green Infrastructure Components
People perceived different benefits from green infrastructure components (Table 5).
Benefits were referred to the environmental and social dimensions of sustainability
(e.g. enhancement of quality of life or contributions to social inclusion).
Parks obtained most positive rates. Green corridors and natural areas followed.
The highest positive rate (84%) was for the component of green corridors. People believed that they contribute to enhance environmental quality, specifically air
quality. Parks were associated with social values and health benefits (87 and 82%
respectively). It can be expected that the green is the key element that provides these
benefits. Additionally, this means that green corridors and parks are key open spaces
to perceive benefits from green infrastructure.