

578
G. Nicolino and S. R. S. Barros
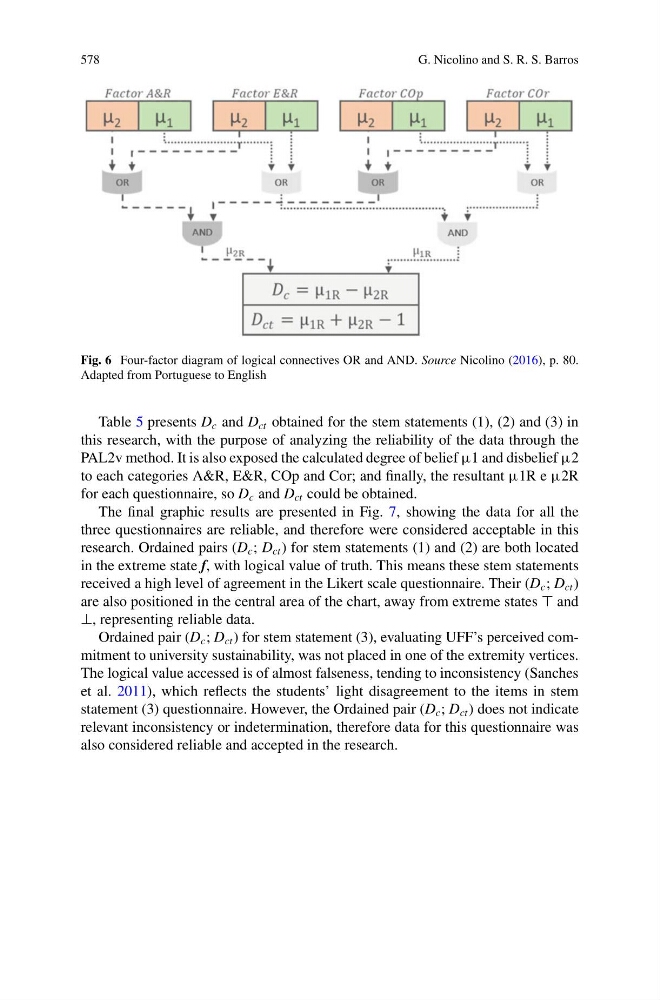
Fig. 6 Four-factor diagram of logical connectives OR and AND. Source Nicolino (2016), p. 80.
Adapted from Portuguese to English
Table 5 presents D c and D ct obtained for the stem statements (1), (2) and (3) in
this research, with the purpose of analyzing the reliability of the data through the
PAL2v method. It is also exposed the calculated degree of belief µ1 and disbelief µ2
to each categories A&R, E&R, COp and Cor; and finally, the resultant µ1R e µ2R
for each questionnaire, so D c and D ct could be obtained.
The final graphic results are presented in Fig. 7, showing the data for all the
three questionnaires are reliable, and therefore were considered acceptable in this
research. Ordained pairs (D c ; D ct ) for stem statements (1) and (2) are both located
in the extreme state f, with logical value of truth. This means these stem statements
received a high level of agreement in the Likert scale questionnaire. Their (D c ; D ct )
are also positioned in the central area of the chart, away from extreme states and
⊥, representing reliable data.
Ordained pair (D c ; D ct ) for stem statement (3), evaluating UFF’s perceived commitment to university sustainability, was not placed in one of the extremity vertices.
The logical value accessed is of almost falseness, tending to inconsistency (Sanches
et al. 2011), which reflects the students’ light disagreement to the items in stem
statement (3) questionnaire. However, the Ordained pair (D c ; D ct ) does not indicate
relevant inconsistency or indetermination, therefore data for this questionnaire was
also considered reliable and accepted in the research.
G. Nicolino and S. R. S. Barros
Fig. 6 Four-factor diagram of logical connectives OR and AND. Source Nicolino (2016), p. 80.
Adapted from Portuguese to English
Table 5 presents D c and D ct obtained for the stem statements (1), (2) and (3) in
this research, with the purpose of analyzing the reliability of the data through the
PAL2v method. It is also exposed the calculated degree of belief µ1 and disbelief µ2
to each categories A&R, E&R, COp and Cor; and finally, the resultant µ1R e µ2R
for each questionnaire, so D c and D ct could be obtained.
The final graphic results are presented in Fig. 7, showing the data for all the
three questionnaires are reliable, and therefore were considered acceptable in this
research. Ordained pairs (D c ; D ct ) for stem statements (1) and (2) are both located
in the extreme state f, with logical value of truth. This means these stem statements
received a high level of agreement in the Likert scale questionnaire. Their (D c ; D ct )
are also positioned in the central area of the chart, away from extreme states and
⊥, representing reliable data.
Ordained pair (D c ; D ct ) for stem statement (3), evaluating UFF’s perceived commitment to university sustainability, was not placed in one of the extremity vertices.
The logical value accessed is of almost falseness, tending to inconsistency (Sanches
et al. 2011), which reflects the students’ light disagreement to the items in stem
statement (3) questionnaire. However, the Ordained pair (D c ; D ct ) does not indicate
relevant inconsistency or indetermination, therefore data for this questionnaire was
also considered reliable and accepted in the research.