

Urban Management: Learning from Green Infrastructure …
505
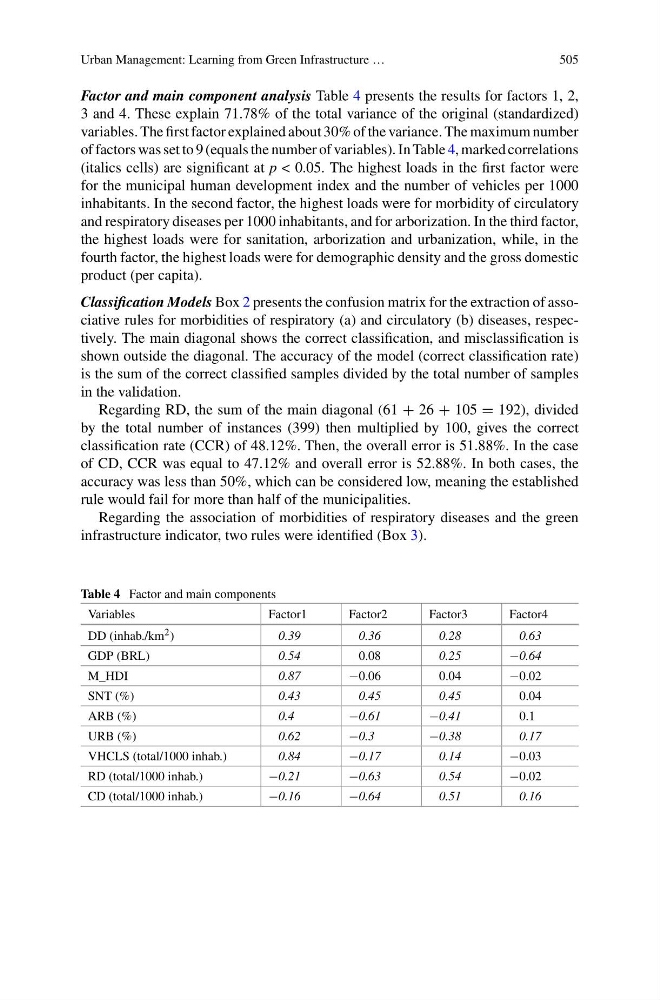
Factor and main component analysis Table 4 presents the results for factors 1, 2,
3 and 4. These explain 71.78% of the total variance of the original (standardized)
variables. The first factor explained about 30% of the variance. The maximum number
of factors was set to 9 (equals the number of variables). In Table 4, marked correlations
(italics cells) are significant at p < 0.05. The highest loads in the first factor were
for the municipal human development index and the number of vehicles per 1000
inhabitants. In the second factor, the highest loads were for morbidity of circulatory
and respiratory diseases per 1000 inhabitants, and for arborization. In the third factor,
the highest loads were for sanitation, arborization and urbanization, while, in the
fourth factor, the highest loads were for demographic density and the gross domestic
product (per capita).
Classification Models Box 2 presents the confusion matrix for the extraction of associative rules for morbidities of respiratory (a) and circulatory (b) diseases, respectively. The main diagonal shows the correct classification, and misclassification is
shown outside the diagonal. The accuracy of the model (correct classification rate)
is the sum of the correct classified samples divided by the total number of samples
in the validation.
Regarding RD, the sum of the main diagonal (61 + 26 + 105 = 192), divided
by the total number of instances (399) then multiplied by 100, gives the correct
classification rate (CCR) of 48.12%. Then, the overall error is 51.88%. In the case
of CD, CCR was equal to 47.12% and overall error is 52.88%. In both cases, the
accuracy was less than 50%, which can be considered low, meaning the established
rule would fail for more than half of the municipalities.
Regarding the association of morbidities of respiratory diseases and the green
infrastructure indicator, two rules were identified (Box 3).
Table 4 Factor and main components
Variables
Factor1
Factor2
Factor3
Factor4
DD (inhab./km 2 )
0.39
0.36
0.28
0.63
GDP (BRL)
0.54
0.08
0.25
−0.64
M_HDI
0.87
−0.06
0.04
−0.02
SNT (%)
0.43
0.45
0.45
0.04
ARB (%)
0.4
−0.61
−0.41
0.1
URB (%)
0.62
−0.3
−0.38
0.17
VHCLS (total/1000 inhab.)
0.84
−0.17
0.14
−0.03
RD (total/1000 inhab.)
−0.21
−0.63
0.54
−0.02
CD (total/1000 inhab.)
−0.16
−0.64
0.51
0.16
505
Factor and main component analysis Table 4 presents the results for factors 1, 2,
3 and 4. These explain 71.78% of the total variance of the original (standardized)
variables. The first factor explained about 30% of the variance. The maximum number
of factors was set to 9 (equals the number of variables). In Table 4, marked correlations
(italics cells) are significant at p < 0.05. The highest loads in the first factor were
for the municipal human development index and the number of vehicles per 1000
inhabitants. In the second factor, the highest loads were for morbidity of circulatory
and respiratory diseases per 1000 inhabitants, and for arborization. In the third factor,
the highest loads were for sanitation, arborization and urbanization, while, in the
fourth factor, the highest loads were for demographic density and the gross domestic
product (per capita).
Classification Models Box 2 presents the confusion matrix for the extraction of associative rules for morbidities of respiratory (a) and circulatory (b) diseases, respectively. The main diagonal shows the correct classification, and misclassification is
shown outside the diagonal. The accuracy of the model (correct classification rate)
is the sum of the correct classified samples divided by the total number of samples
in the validation.
Regarding RD, the sum of the main diagonal (61 + 26 + 105 = 192), divided
by the total number of instances (399) then multiplied by 100, gives the correct
classification rate (CCR) of 48.12%. Then, the overall error is 51.88%. In the case
of CD, CCR was equal to 47.12% and overall error is 52.88%. In both cases, the
accuracy was less than 50%, which can be considered low, meaning the established
rule would fail for more than half of the municipalities.
Regarding the association of morbidities of respiratory diseases and the green
infrastructure indicator, two rules were identified (Box 3).
Table 4 Factor and main components
Variables
Factor1
Factor2
Factor3
Factor4
DD (inhab./km 2 )
0.39
0.36
0.28
0.63
GDP (BRL)
0.54
0.08
0.25
−0.64
M_HDI
0.87
−0.06
0.04
−0.02
SNT (%)
0.43
0.45
0.45
0.04
ARB (%)
0.4
−0.61
−0.41
0.1
URB (%)
0.62
−0.3
−0.38
0.17
VHCLS (total/1000 inhab.)
0.84
−0.17
0.14
−0.03
RD (total/1000 inhab.)
−0.21
−0.63
0.54
−0.02
CD (total/1000 inhab.)
−0.16
−0.64
0.51
0.16