

504
L. Pimentel da Silva and F. T. de Souza
G1
G2
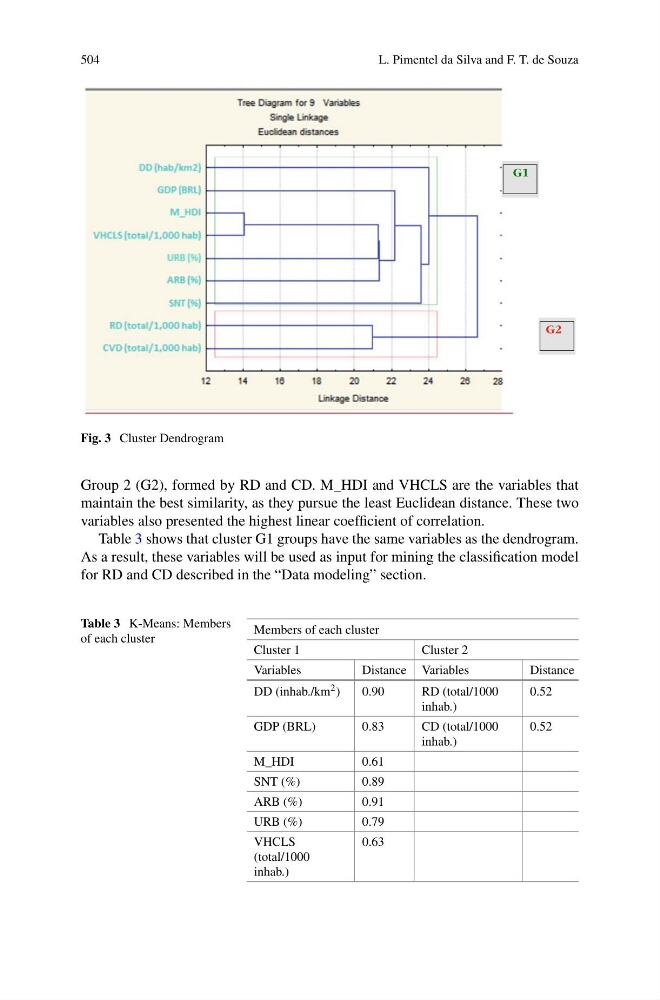
Fig. 3 Cluster Dendrogram
Group 2 (G2), formed by RD and CD. M_HDI and VHCLS are the variables that
maintain the best similarity, as they pursue the least Euclidean distance. These two
variables also presented the highest linear coefficient of correlation.
Table 3 shows that cluster G1 groups have the same variables as the dendrogram.
As a result, these variables will be used as input for mining the classification model
for RD and CD described in the “Data modeling” section.
Table 3 K-Means: Members
of each cluster
Members of each cluster
Cluster 1
Cluster 2
Variables
Distance Variables
Distance
DD (inhab./km 2 )
0.90
RD (total/1000
inhab.)
0.52
GDP (BRL)
0.83
CD (total/1000
inhab.)
0.52
M_HDI
0.61
SNT (%)
0.89
ARB (%)
0.91
URB (%)
0.79
VHCLS
(total/1000
inhab.)
0.63
L. Pimentel da Silva and F. T. de Souza
G1
G2
Fig. 3 Cluster Dendrogram
Group 2 (G2), formed by RD and CD. M_HDI and VHCLS are the variables that
maintain the best similarity, as they pursue the least Euclidean distance. These two
variables also presented the highest linear coefficient of correlation.
Table 3 shows that cluster G1 groups have the same variables as the dendrogram.
As a result, these variables will be used as input for mining the classification model
for RD and CD described in the “Data modeling” section.
Table 3 K-Means: Members
of each cluster
Members of each cluster
Cluster 1
Cluster 2
Variables
Distance Variables
Distance
DD (inhab./km 2 )
0.90
RD (total/1000
inhab.)
0.52
GDP (BRL)
0.83
CD (total/1000
inhab.)
0.52
M_HDI
0.61
SNT (%)
0.89
ARB (%)
0.91
URB (%)
0.79
VHCLS
(total/1000
inhab.)
0.63