

Economic Complexity and the Environment: Evidence from Brazil
33
Table 7
(continued)
(1)
(2)
(3)
(4)
(5)
(6)
(7)
(8)
Dependent variable: average PM10 concentrations
Constant
−0.0206
−0.0510*
−0.0279
−0.0587**
−0.0456
−0.0492
−0.0912
−0.103
(0.0183)
(0.0213)
(0.0267)
(0.0198)
(0.0241)
(0.0427)
(0.0867)
(0.0842)
Observations
39
32
32
32
32
32
32
32
R-squared
0.009
0.121
0.115
0.225
0.107
0.106
0.231
0.245
Adjusted R-squared
−0.0457
0.0272
0.0199
0.142
0.0110
0.00983
0.0459
−0.0177
Notes
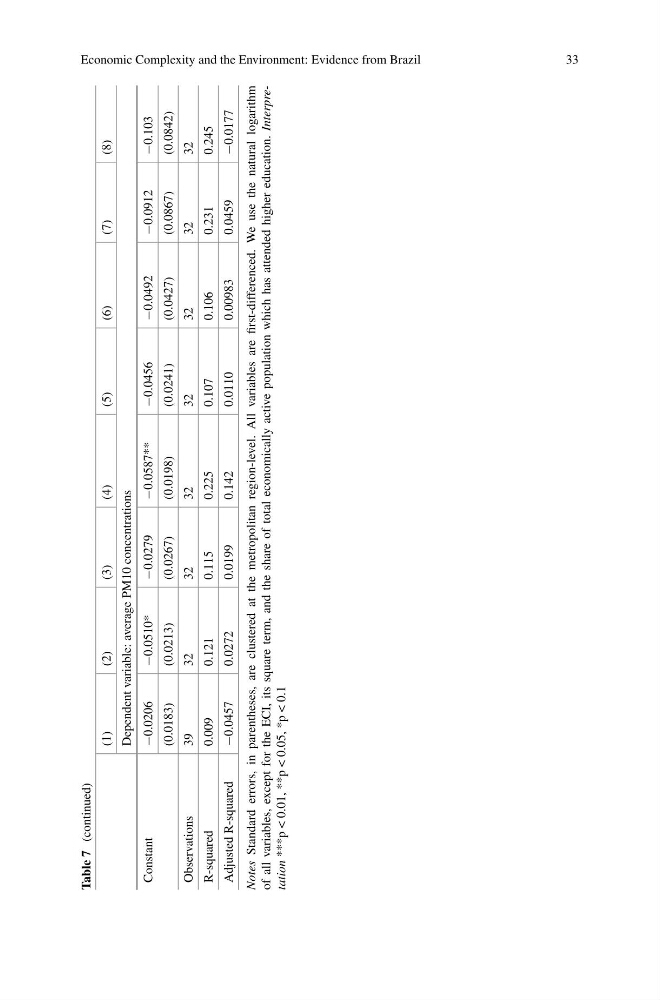
Standard errors, in parentheses, are clustered at the metropolitan region-level. All variables are first-differenced. We use the natural logarithm
of all variables, except for the ECI, its square term, and the share of total economically active population which has attended higher education. Interpretation
***p < 0.01, **p < 0.05, *p < 0.1
33
Table 7
(continued)
(1)
(2)
(3)
(4)
(5)
(6)
(7)
(8)
Dependent variable: average PM10 concentrations
Constant
−0.0206
−0.0510*
−0.0279
−0.0587**
−0.0456
−0.0492
−0.0912
−0.103
(0.0183)
(0.0213)
(0.0267)
(0.0198)
(0.0241)
(0.0427)
(0.0867)
(0.0842)
Observations
39
32
32
32
32
32
32
32
R-squared
0.009
0.121
0.115
0.225
0.107
0.106
0.231
0.245
Adjusted R-squared
−0.0457
0.0272
0.0199
0.142
0.0110
0.00983
0.0459
−0.0177
Notes
Standard errors, in parentheses, are clustered at the metropolitan region-level. All variables are first-differenced. We use the natural logarithm
of all variables, except for the ECI, its square term, and the share of total economically active population which has attended higher education. Interpretation
***p < 0.01, **p < 0.05, *p < 0.1