

280
J. F. Guidolini et al.
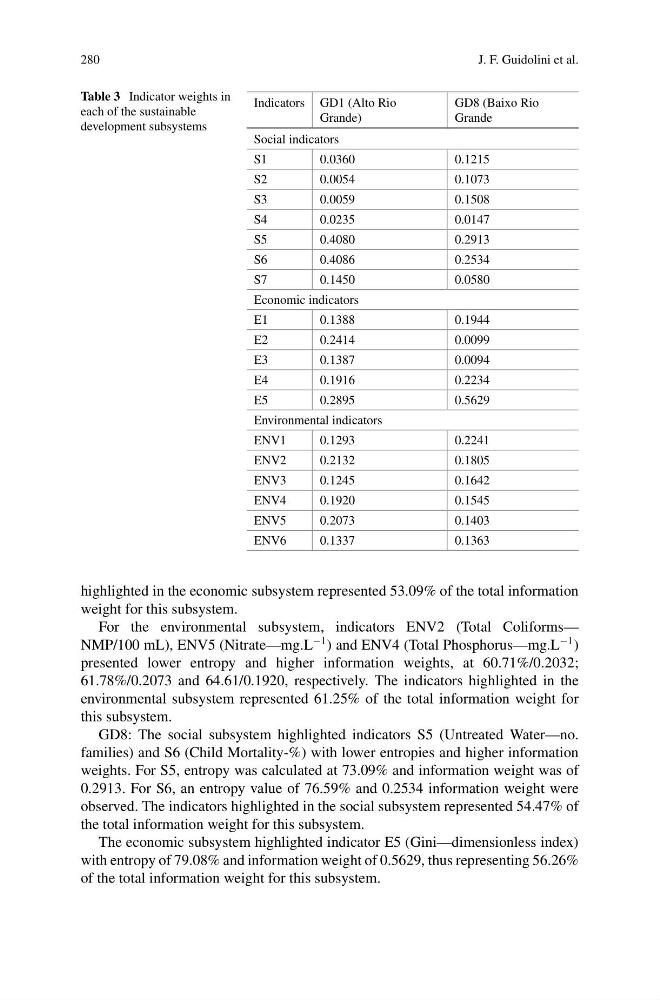
Table 3 Indicator weights in
each of the sustainable
development subsystems
Indicators GD1 (Alto Rio
Grande)
GD8 (Baixo Rio
Grande
Social indicators
S1
0.0360
0.1215
S2
0.0054
0.1073
S3
0.0059
0.1508
S4
0.0235
0.0147
S5
0.4080
0.2913
S6
0.4086
0.2534
S7
0.1450
0.0580
Economic indicators
E1
0.1388
0.1944
E2
0.2414
0.0099
E3
0.1387
0.0094
E4
0.1916
0.2234
E5
0.2895
0.5629
Environmental indicators
ENV1
0.1293
0.2241
ENV2
0.2132
0.1805
ENV3
0.1245
0.1642
ENV4
0.1920
0.1545
ENV5
0.2073
0.1403
ENV6
0.1337
0.1363
highlighted in the economic subsystem represented 53.09% of the total information
weight for this subsystem.
For the environmental subsystem, indicators ENV2 (Total Coliforms—
NMP/100 mL), ENV5 (Nitrate—mg.L
−1 ) and ENV4 (Total Phosphorus—mg.L
−1 )
presented lower entropy and higher information weights, at 60.71%/0.2032;
61.78%/0.2073 and 64.61/0.1920, respectively. The indicators highlighted in the
environmental subsystem represented 61.25% of the total information weight for
this subsystem.
GD8: The social subsystem highlighted indicators S5 (Untreated Water—no.
families) and S6 (Child Mortality-%) with lower entropies and higher information
weights. For S5, entropy was calculated at 73.09% and information weight was of
0.2913. For S6, an entropy value of 76.59% and 0.2534 information weight were
observed. The indicators highlighted in the social subsystem represented 54.47% of
the total information weight for this subsystem.
The economic subsystem highlighted indicator E5 (Gini—dimensionless index)
with entropy of 79.08% and information weight of 0.5629, thus representing 56.26%
of the total information weight for this subsystem.
J. F. Guidolini et al.
Table 3 Indicator weights in
each of the sustainable
development subsystems
Indicators GD1 (Alto Rio
Grande)
GD8 (Baixo Rio
Grande
Social indicators
S1
0.0360
0.1215
S2
0.0054
0.1073
S3
0.0059
0.1508
S4
0.0235
0.0147
S5
0.4080
0.2913
S6
0.4086
0.2534
S7
0.1450
0.0580
Economic indicators
E1
0.1388
0.1944
E2
0.2414
0.0099
E3
0.1387
0.0094
E4
0.1916
0.2234
E5
0.2895
0.5629
Environmental indicators
ENV1
0.1293
0.2241
ENV2
0.2132
0.1805
ENV3
0.1245
0.1642
ENV4
0.1920
0.1545
ENV5
0.2073
0.1403
ENV6
0.1337
0.1363
highlighted in the economic subsystem represented 53.09% of the total information
weight for this subsystem.
For the environmental subsystem, indicators ENV2 (Total Coliforms—
NMP/100 mL), ENV5 (Nitrate—mg.L
−1 ) and ENV4 (Total Phosphorus—mg.L
−1 )
presented lower entropy and higher information weights, at 60.71%/0.2032;
61.78%/0.2073 and 64.61/0.1920, respectively. The indicators highlighted in the
environmental subsystem represented 61.25% of the total information weight for
this subsystem.
GD8: The social subsystem highlighted indicators S5 (Untreated Water—no.
families) and S6 (Child Mortality-%) with lower entropies and higher information
weights. For S5, entropy was calculated at 73.09% and information weight was of
0.2913. For S6, an entropy value of 76.59% and 0.2534 information weight were
observed. The indicators highlighted in the social subsystem represented 54.47% of
the total information weight for this subsystem.
The economic subsystem highlighted indicator E5 (Gini—dimensionless index)
with entropy of 79.08% and information weight of 0.5629, thus representing 56.26%
of the total information weight for this subsystem.