

Application of Information Entropy to Assessment Environmental …
279
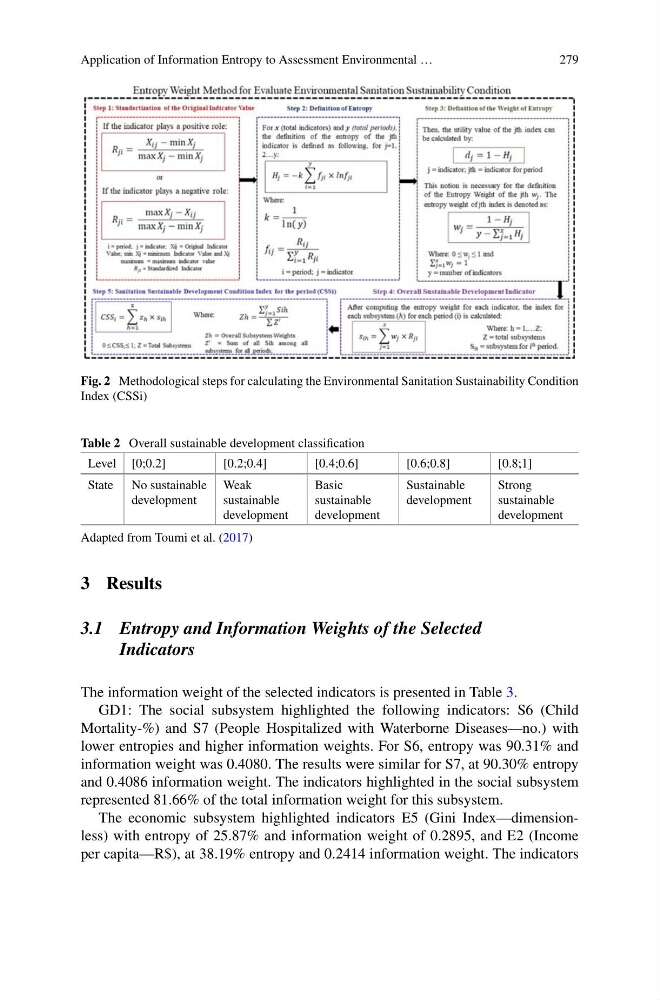
Fig. 2 Methodological steps for calculating the Environmental Sanitation Sustainability Condition
Index (CSSi)
Table 2 Overall sustainable development classification
Level [0;0.2]
[0.2;0.4]
[0.4;0.6]
[0.6;0.8]
[0.8;1]
State No sustainable
development
Weak
sustainable
development
Basic
sustainable
development
Sustainable
development
Strong
sustainable
development
Adapted from Toumi et al. (2017)
3 Results
3.1 Entropy and Information Weights of the Selected
Indicators
The information weight of the selected indicators is presented in Table 3.
GD1: The social subsystem highlighted the following indicators: S6 (Child
Mortality-%) and S7 (People Hospitalized with Waterborne Diseases—no.) with
lower entropies and higher information weights. For S6, entropy was 90.31% and
information weight was 0.4080. The results were similar for S7, at 90.30% entropy
and 0.4086 information weight. The indicators highlighted in the social subsystem
represented 81.66% of the total information weight for this subsystem.
The economic subsystem highlighted indicators E5 (Gini Index—dimensionless) with entropy of 25.87% and information weight of 0.2895, and E2 (Income
per capita—R$), at 38.19% entropy and 0.2414 information weight. The indicators
279
Fig. 2 Methodological steps for calculating the Environmental Sanitation Sustainability Condition
Index (CSSi)
Table 2 Overall sustainable development classification
Level [0;0.2]
[0.2;0.4]
[0.4;0.6]
[0.6;0.8]
[0.8;1]
State No sustainable
development
Weak
sustainable
development
Basic
sustainable
development
Sustainable
development
Strong
sustainable
development
Adapted from Toumi et al. (2017)
3 Results
3.1 Entropy and Information Weights of the Selected
Indicators
The information weight of the selected indicators is presented in Table 3.
GD1: The social subsystem highlighted the following indicators: S6 (Child
Mortality-%) and S7 (People Hospitalized with Waterborne Diseases—no.) with
lower entropies and higher information weights. For S6, entropy was 90.31% and
information weight was 0.4080. The results were similar for S7, at 90.30% entropy
and 0.4086 information weight. The indicators highlighted in the social subsystem
represented 81.66% of the total information weight for this subsystem.
The economic subsystem highlighted indicators E5 (Gini Index—dimensionless) with entropy of 25.87% and information weight of 0.2895, and E2 (Income
per capita—R$), at 38.19% entropy and 0.2414 information weight. The indicators