

90
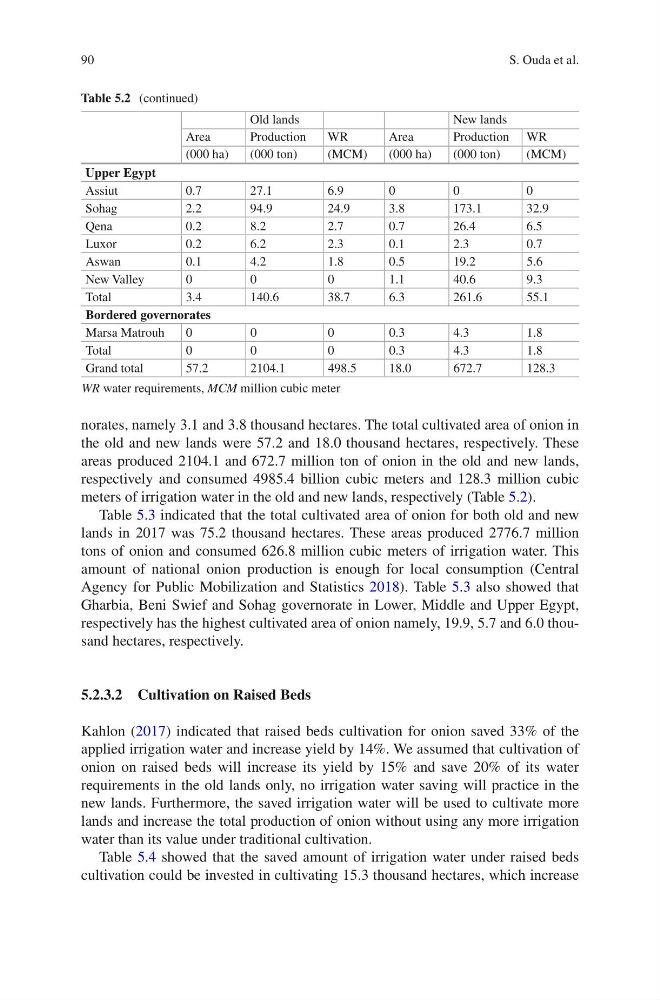
norates, namely 3.1 and 3.8 thousand hectares. The total cultivated area of onion in
the old and new lands were 57.2 and 18.0 thousand hectares, respectively. These
areas produced 2104.1 and 672.7 million ton of onion in the old and new lands,
respectively and consumed 4985.4 billion cubic meters and 128.3 million cubic
meters of irrigation water in the old and new lands, respectively (Table 5.2).
Table 5.3 indicated that the total cultivated area of onion for both old and new
lands in 2017 was 75.2 thousand hectares. These areas produced 2776.7 million
tons of onion and consumed 626.8 million cubic meters of irrigation water. This
amount of national onion production is enough for local consumption (Central
Agency for Public Mobilization and Statistics 2018). Table 5.3 also showed that
Gharbia, Beni Swief and Sohag governorate in Lower, Middle and Upper Egypt,
respectively has the highest cultivated area of onion namely, 19.9, 5.7 and 6.0 thousand hectares, respectively.
5.2.3.2 Cultivation on Raised Beds
Kahlon (2017) indicated that raised beds cultivation for onion saved 33% of the
applied irrigation water and increase yield by 14%. We assumed that cultivation of
onion on raised beds will increase its yield by 15% and save 20% of its water
requirements in the old lands only, no irrigation water saving will practice in the
new lands. Furthermore, the saved irrigation water will be used to cultivate more
lands and increase the total production of onion without using any more irrigation
water than its value under traditional cultivation.
Table 5.4 showed that the saved amount of irrigation water under raised beds
cultivation could be invested in cultivating 15.3 thousand hectares, which increase
Table 5.2 (continued)
Old lands
New lands
Area
Production
WR
Area
Production WR
(000 ha)
(000 ton)
(MCM)
(000 ha)
(000 ton)
(MCM)
Upper Egypt
Assiut
0.7
27.1
6.9
0
0
0
Sohag
2.2
94.9
24.9
3.8
173.1
32.9
Qena
0.2
8.2
2.7
0.7
26.4
6.5
Luxor
0.2
6.2
2.3
0.1
2.3
0.7
Aswan
0.1
4.2
1.8
0.5
19.2
5.6
New Valley
0
0
0
1.1
40.6
9.3
Total
3.4
140.6
38.7
6.3
261.6
55.1
Bordered governorates
Marsa Matrouh
0
0
0
0.3
4.3
1.8
Total
0
0
0
0.3
4.3
1.8
Grand total
57.2
2104.1
498.5
18.0
672.7
128.3
WR water requirements, MCM million cubic meter
S. Ouda et al.
norates, namely 3.1 and 3.8 thousand hectares. The total cultivated area of onion in
the old and new lands were 57.2 and 18.0 thousand hectares, respectively. These
areas produced 2104.1 and 672.7 million ton of onion in the old and new lands,
respectively and consumed 4985.4 billion cubic meters and 128.3 million cubic
meters of irrigation water in the old and new lands, respectively (Table 5.2).
Table 5.3 indicated that the total cultivated area of onion for both old and new
lands in 2017 was 75.2 thousand hectares. These areas produced 2776.7 million
tons of onion and consumed 626.8 million cubic meters of irrigation water. This
amount of national onion production is enough for local consumption (Central
Agency for Public Mobilization and Statistics 2018). Table 5.3 also showed that
Gharbia, Beni Swief and Sohag governorate in Lower, Middle and Upper Egypt,
respectively has the highest cultivated area of onion namely, 19.9, 5.7 and 6.0 thousand hectares, respectively.
5.2.3.2 Cultivation on Raised Beds
Kahlon (2017) indicated that raised beds cultivation for onion saved 33% of the
applied irrigation water and increase yield by 14%. We assumed that cultivation of
onion on raised beds will increase its yield by 15% and save 20% of its water
requirements in the old lands only, no irrigation water saving will practice in the
new lands. Furthermore, the saved irrigation water will be used to cultivate more
lands and increase the total production of onion without using any more irrigation
water than its value under traditional cultivation.
Table 5.4 showed that the saved amount of irrigation water under raised beds
cultivation could be invested in cultivating 15.3 thousand hectares, which increase
Table 5.2 (continued)
Old lands
New lands
Area
Production
WR
Area
Production WR
(000 ha)
(000 ton)
(MCM)
(000 ha)
(000 ton)
(MCM)
Upper Egypt
Assiut
0.7
27.1
6.9
0
0
0
Sohag
2.2
94.9
24.9
3.8
173.1
32.9
Qena
0.2
8.2
2.7
0.7
26.4
6.5
Luxor
0.2
6.2
2.3
0.1
2.3
0.7
Aswan
0.1
4.2
1.8
0.5
19.2
5.6
New Valley
0
0
0
1.1
40.6
9.3
Total
3.4
140.6
38.7
6.3
261.6
55.1
Bordered governorates
Marsa Matrouh
0
0
0
0.3
4.3
1.8
Total
0
0
0
0.3
4.3
1.8
Grand total
57.2
2104.1
498.5
18.0
672.7
128.3
WR water requirements, MCM million cubic meter
S. Ouda et al.