

168
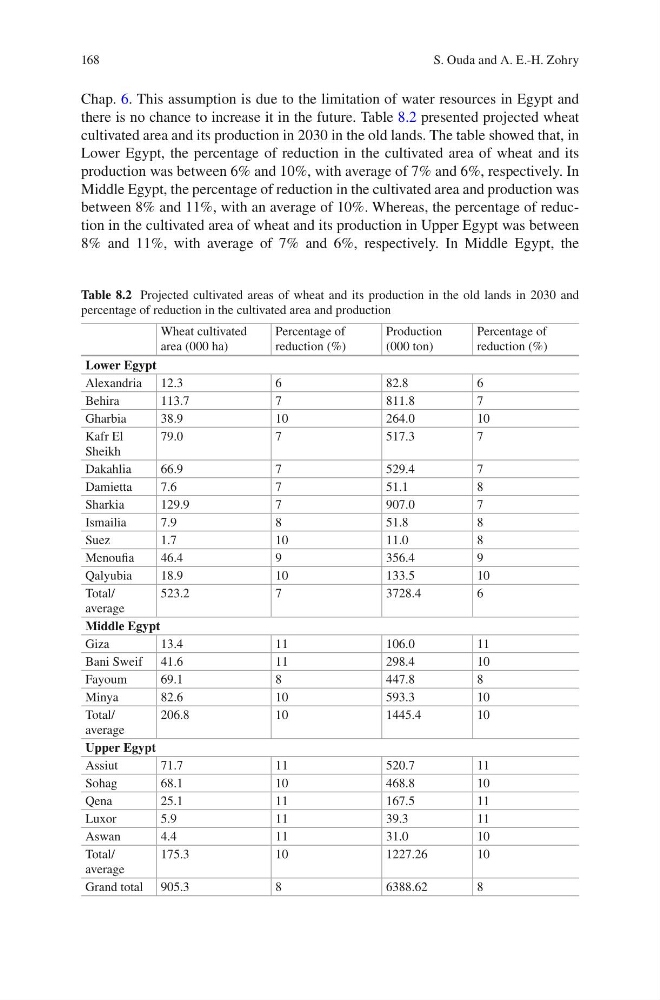
Chap. 6. This assumption is due to the limitation of water resources in Egypt and
there is no chance to increase it in the future. Table 8.2 presented projected wheat
cultivated area and its production in 2030 in the old lands. The table showed that, in
Lower Egypt, the percentage of reduction in the cultivated area of wheat and its
production was between 6% and 10%, with average of 7% and 6%, respectively. In
Middle Egypt, the percentage of reduction in the cultivated area and production was
between 8% and 11%, with an average of 10%. Whereas, the percentage of reduction in the cultivated area of wheat and its production in Upper Egypt was between
8% and 11%, with average of 7% and 6%, respectively. In Middle Egypt, the
Table 8.2 Projected cultivated areas of wheat and its production in the old lands in 2030 and
percentage of reduction in the cultivated area and production
Wheat cultivated
area (000 ha)
Percentage of
reduction (%)
Production
(000 ton)
Percentage of
reduction (%)
Lower Egypt
Alexandria 12.3
6
82.8
6
Behira
113.7
7
811.8
7
Gharbia
38.9
10
264.0
10
Kafr El
Sheikh
79.0
7
517.3
7
Dakahlia
66.9
7
529.4
7
Damietta
7.6
7
51.1
8
Sharkia
129.9
7
907.0
7
Ismailia
7.9
8
51.8
8
Suez
1.7
10
11.0
8
Menoufia
46.4
9
356.4
9
Qalyubia
18.9
10
133.5
10
Total/
average
523.2
7
3728.4
6
Middle Egypt
Giza
13.4
11
106.0
11
Bani Sweif 41.6
11
298.4
10
Fayoum
69.1
8
447.8
8
Minya
82.6
10
593.3
10
Total/
average
206.8
10
1445.4
10
Upper Egypt
Assiut
71.7
11
520.7
11
Sohag
68.1
10
468.8
10
Qena
25.1
11
167.5
11
Luxor
5.9
11
39.3
11
Aswan
4.4
11
31.0
10
Total/
average
175.3
10
1227.26
10
Grand total 905.3
8
6388.62
8
S. Ouda and A. E.-H. Zohry
Chap. 6. This assumption is due to the limitation of water resources in Egypt and
there is no chance to increase it in the future. Table 8.2 presented projected wheat
cultivated area and its production in 2030 in the old lands. The table showed that, in
Lower Egypt, the percentage of reduction in the cultivated area of wheat and its
production was between 6% and 10%, with average of 7% and 6%, respectively. In
Middle Egypt, the percentage of reduction in the cultivated area and production was
between 8% and 11%, with an average of 10%. Whereas, the percentage of reduction in the cultivated area of wheat and its production in Upper Egypt was between
8% and 11%, with average of 7% and 6%, respectively. In Middle Egypt, the
Table 8.2 Projected cultivated areas of wheat and its production in the old lands in 2030 and
percentage of reduction in the cultivated area and production
Wheat cultivated
area (000 ha)
Percentage of
reduction (%)
Production
(000 ton)
Percentage of
reduction (%)
Lower Egypt
Alexandria 12.3
6
82.8
6
Behira
113.7
7
811.8
7
Gharbia
38.9
10
264.0
10
Kafr El
Sheikh
79.0
7
517.3
7
Dakahlia
66.9
7
529.4
7
Damietta
7.6
7
51.1
8
Sharkia
129.9
7
907.0
7
Ismailia
7.9
8
51.8
8
Suez
1.7
10
11.0
8
Menoufia
46.4
9
356.4
9
Qalyubia
18.9
10
133.5
10
Total/
average
523.2
7
3728.4
6
Middle Egypt
Giza
13.4
11
106.0
11
Bani Sweif 41.6
11
298.4
10
Fayoum
69.1
8
447.8
8
Minya
82.6
10
593.3
10
Total/
average
206.8
10
1445.4
10
Upper Egypt
Assiut
71.7
11
520.7
11
Sohag
68.1
10
468.8
10
Qena
25.1
11
167.5
11
Luxor
5.9
11
39.3
11
Aswan
4.4
11
31.0
10
Total/
average
175.3
10
1227.26
10
Grand total 905.3
8
6388.62
8
S. Ouda and A. E.-H. Zohry