

150
ues in 2016. The values of Kc med were higher in 2030 and Kc end values were lower
in 2030, compared to its counterpart values in 2016, except for potato, squach, and
sweet potato. The projected increase in the Kc values, especially in the middle of the
growing season, where maximum growth existed, will cause increases in irrigation
amounts required to satisfy the needs of these crops.
7.6 Effect of Climate Change on Water Consumptive Use/
Water Requirements of Crops
MAGICC/SCENGEN model was used to calculate the annual mean global surface
air temperature and global-mean Sea-level implications of emissions scenarios for
greenhouse gases. SCENGEN model was run using CSIRO-GCM model and climatic data were extracted using regression model for year 2000 and 2050. Eid et al.
(1992) indicated that climate change could increase crops water demand for summer and winter crops by 16 and 2%, respectively in the year 2050.
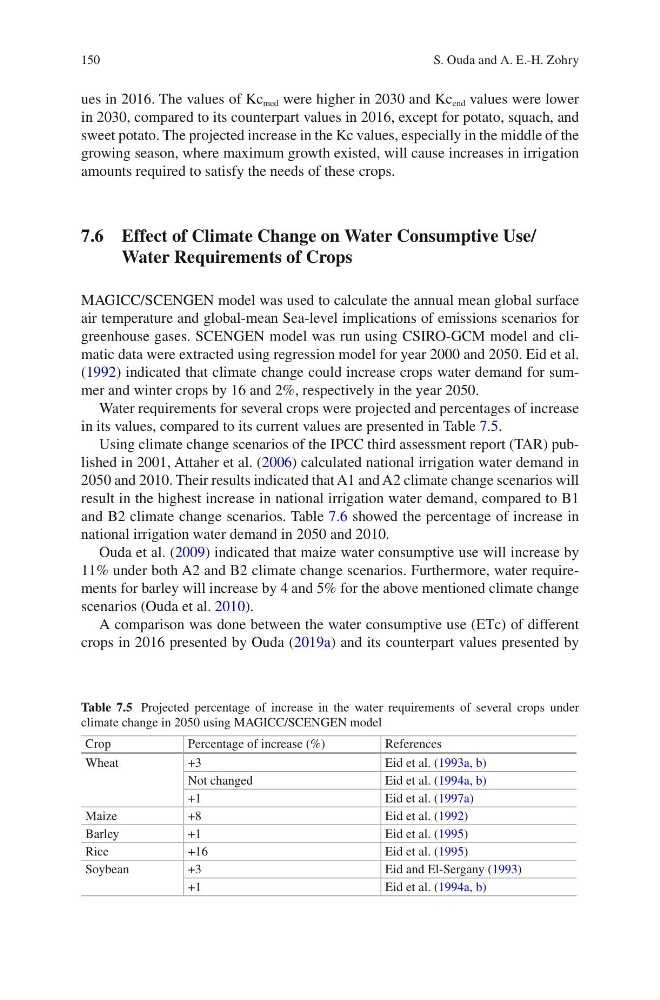
Water requirements for several crops were projected and percentages of increase
in its values, compared to its current values are presented in Table 7.5.
Using climate change scenarios of the IPCC third assessment report (TAR) published in 2001, Attaher et al. (2006) calculated national irrigation water demand in
2050 and 2010. Their results indicated that A1 and A2 climate change scenarios will
result in the highest increase in national irrigation water demand, compared to B1
and B2 climate change scenarios. Table 7.6 showed the percentage of increase in
national irrigation water demand in 2050 and 2010.
Ouda et al. (2009) indicated that maize water consumptive use will increase by
11% under both A2 and B2 climate change scenarios. Furthermore, water requirements for barley will increase by 4 and 5% for the above mentioned climate change
scenarios (Ouda et al. 2010).
A comparison was done between the water consumptive use (ETc) of different
crops in 2016 presented by Ouda (2019a) and its counterpart values presented by
Table 7.5 Projected percentage of increase in the water requirements of several crops under
climate change in 2050 using MAGICC/SCENGEN model
Crop
Percentage of increase (%)
References
Wheat
+3
Eid et al. (1993a, b)
Not changed
Eid et al. (1994a, b)
+1
Eid et al. (1997a)
Maize
+8
Eid et al. (1992)
Barley
+1
Eid et al. (1995)
Rice
+16
Eid et al. (1995)
Soybean
+3
Eid and El-Sergany (1993)
+1
Eid et al. (1994a, b)
S. Ouda and A. E.-H. Zohry
ues in 2016. The values of Kc med were higher in 2030 and Kc end values were lower
in 2030, compared to its counterpart values in 2016, except for potato, squach, and
sweet potato. The projected increase in the Kc values, especially in the middle of the
growing season, where maximum growth existed, will cause increases in irrigation
amounts required to satisfy the needs of these crops.
7.6 Effect of Climate Change on Water Consumptive Use/
Water Requirements of Crops
MAGICC/SCENGEN model was used to calculate the annual mean global surface
air temperature and global-mean Sea-level implications of emissions scenarios for
greenhouse gases. SCENGEN model was run using CSIRO-GCM model and climatic data were extracted using regression model for year 2000 and 2050. Eid et al.
(1992) indicated that climate change could increase crops water demand for summer and winter crops by 16 and 2%, respectively in the year 2050.
Water requirements for several crops were projected and percentages of increase
in its values, compared to its current values are presented in Table 7.5.
Using climate change scenarios of the IPCC third assessment report (TAR) published in 2001, Attaher et al. (2006) calculated national irrigation water demand in
2050 and 2010. Their results indicated that A1 and A2 climate change scenarios will
result in the highest increase in national irrigation water demand, compared to B1
and B2 climate change scenarios. Table 7.6 showed the percentage of increase in
national irrigation water demand in 2050 and 2010.
Ouda et al. (2009) indicated that maize water consumptive use will increase by
11% under both A2 and B2 climate change scenarios. Furthermore, water requirements for barley will increase by 4 and 5% for the above mentioned climate change
scenarios (Ouda et al. 2010).
A comparison was done between the water consumptive use (ETc) of different
crops in 2016 presented by Ouda (2019a) and its counterpart values presented by
Table 7.5 Projected percentage of increase in the water requirements of several crops under
climate change in 2050 using MAGICC/SCENGEN model
Crop
Percentage of increase (%)
References
Wheat
+3
Eid et al. (1993a, b)
Not changed
Eid et al. (1994a, b)
+1
Eid et al. (1997a)
Maize
+8
Eid et al. (1992)
Barley
+1
Eid et al. (1995)
Rice
+16
Eid et al. (1995)
Soybean
+3
Eid and El-Sergany (1993)
+1
Eid et al. (1994a, b)
S. Ouda and A. E.-H. Zohry