

148
temperature obtained from CSIRO-Mk3.5 and minimum temperature obtained from
CNRM-CM3 had the highest closeness to the measured data. Thus, an ensemble
model (ECCM) was developed and composed of solar radiation obtained from
ECHAM5 model, maximum temperature obtained from CSIRO-Mk3.5 model and
minimum temperature obtained from CNRM-CM3 model for A1B, A2 and B1 climate scenarios. The results also showed that ETc values for wheat and maize using
the three climate change scenarios resulted from ECCM model in 2010 were more
close to the values calculated from the measured weather values in the same year.
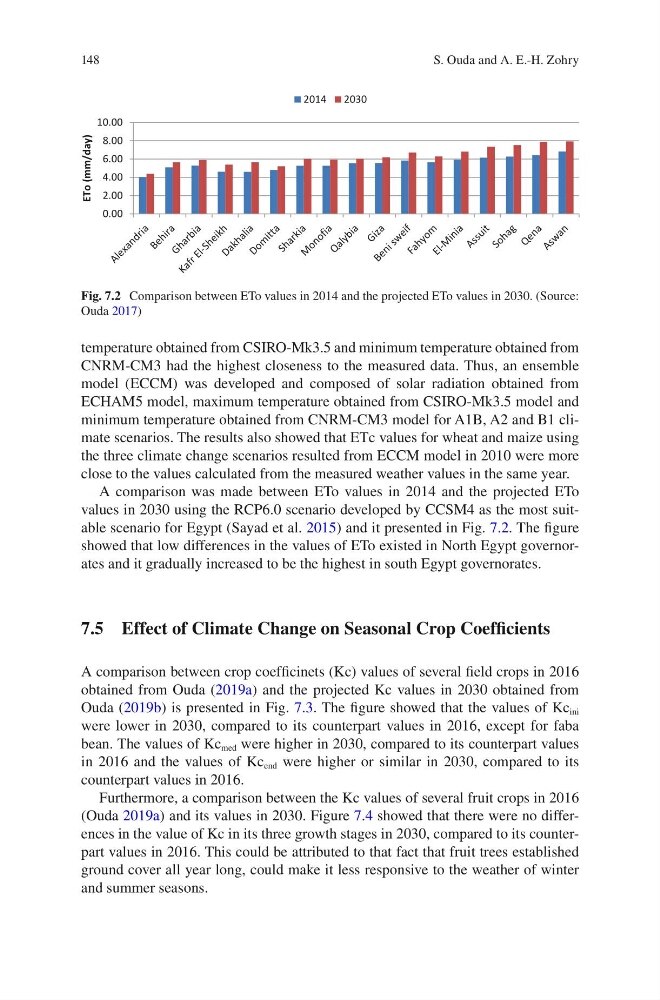
A comparison was made between ETo values in 2014 and the projected ETo
values in 2030 using the RCP6.0 scenario developed by CCSM4 as the most suitable scenario for Egypt (Sayad et al. 2015) and it presented in Fig. 7.2. The figure
showed that low differences in the values of ETo existed in North Egypt governorates and it gradually increased to be the highest in south Egypt governorates.
7.5 Effect of Climate Change on Seasonal Crop Coefficients
A comparison between crop coefficinets (Kc) values of several field crops in 2016
obtained from Ouda (2019a) and the projected Kc values in 2030 obtained from
Ouda (2019b) is presented in Fig. 7.3. The figure showed that the values of Kc ini
were lower in 2030, compared to its counterpart values in 2016, except for faba
bean. The values of Kc med were higher in 2030, compared to its counterpart values
in 2016 and the values of Kc end were higher or similar in 2030, compared to its
counterpart values in 2016.
Furthermore, a comparison between the Kc values of several fruit crops in 2016
(Ouda 2019a) and its values in 2030. Figure 7.4 showed that there were no differences in the value of Kc in its three growth stages in 2030, compared to its counterpart values in 2016. This could be attributed to that fact that fruit trees established
ground cover all year long, could make it less responsive to the weather of winter
and summer seasons.
0.00
2.00
4.00
6.00
8.00
10.00
ETo (mm/day)
2014
2030
Fig. 7.2 Comparison between ETo values in 2014 and the projected ETo values in 2030. (Source:
Ouda 2017)
S. Ouda and A. E.-H. Zohry
temperature obtained from CSIRO-Mk3.5 and minimum temperature obtained from
CNRM-CM3 had the highest closeness to the measured data. Thus, an ensemble
model (ECCM) was developed and composed of solar radiation obtained from
ECHAM5 model, maximum temperature obtained from CSIRO-Mk3.5 model and
minimum temperature obtained from CNRM-CM3 model for A1B, A2 and B1 climate scenarios. The results also showed that ETc values for wheat and maize using
the three climate change scenarios resulted from ECCM model in 2010 were more
close to the values calculated from the measured weather values in the same year.
A comparison was made between ETo values in 2014 and the projected ETo
values in 2030 using the RCP6.0 scenario developed by CCSM4 as the most suitable scenario for Egypt (Sayad et al. 2015) and it presented in Fig. 7.2. The figure
showed that low differences in the values of ETo existed in North Egypt governorates and it gradually increased to be the highest in south Egypt governorates.
7.5 Effect of Climate Change on Seasonal Crop Coefficients
A comparison between crop coefficinets (Kc) values of several field crops in 2016
obtained from Ouda (2019a) and the projected Kc values in 2030 obtained from
Ouda (2019b) is presented in Fig. 7.3. The figure showed that the values of Kc ini
were lower in 2030, compared to its counterpart values in 2016, except for faba
bean. The values of Kc med were higher in 2030, compared to its counterpart values
in 2016 and the values of Kc end were higher or similar in 2030, compared to its
counterpart values in 2016.
Furthermore, a comparison between the Kc values of several fruit crops in 2016
(Ouda 2019a) and its values in 2030. Figure 7.4 showed that there were no differences in the value of Kc in its three growth stages in 2030, compared to its counterpart values in 2016. This could be attributed to that fact that fruit trees established
ground cover all year long, could make it less responsive to the weather of winter
and summer seasons.
0.00
2.00
4.00
6.00
8.00
10.00
ETo (mm/day)
2014
2030
Fig. 7.2 Comparison between ETo values in 2014 and the projected ETo values in 2030. (Source:
Ouda 2017)
S. Ouda and A. E.-H. Zohry