

141
general circulation models project an increase in precipitation on the Blue Nile;
which contributes more than 75% of the Nile flows. Whereas, one-third expect
reduced precipitation. However, it is virtually certain that the Nile Basin has become
warmer and the warming is expected to continue.
Furthermore, Agrawala et al. (2004) indicated that vulnerability of Egypt’s water
resource and its dependence on the Nile is tied to trends in population growth, land
use, and agriculture intensively concentrated along the Nile Valley and Delta.
Alkitkat (2017) projected 32% increase in the Egyptian population by the year of
2030, compared to its value in 2014. Thus, it is likely that Nile water availability to
be increasingly stressed as demand increases, due to growth in population and
increases in temperature leading to greater evaporative losses.
It has also been suggested that Egypt’s precipitation may decrease due to climate
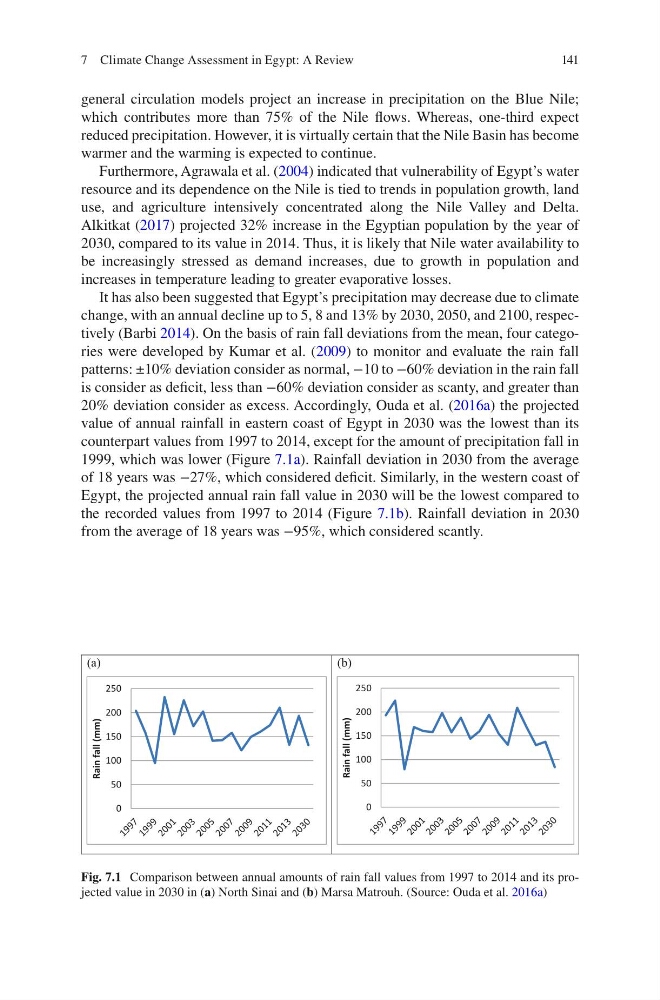
change, with an annual decline up to 5, 8 and 13% by 2030, 2050, and 2100, respectively (Barbi 2014). On the basis of rain fall deviations from the mean, four categories were developed by Kumar et al. (2009) to monitor and evaluate the rain fall
patterns: ±10% deviation consider as normal, −10 to −60% deviation in the rain fall
is consider as deficit, less than −60% deviation consider as scanty, and greater than
20% deviation consider as excess. Accordingly, Ouda et al. (2016a) the projected
value of annual rainfall in eastern coast of Egypt in 2030 was the lowest than its
counterpart values from 1997 to 2014, except for the amount of precipitation fall in
1999, which was lower (Figure 7.1a). Rainfall deviation in 2030 from the average
of 18 years was −27%, which considered deficit. Similarly, in the western coast of
Egypt, the projected annual rain fall value in 2030 will be the lowest compared to
the recorded values from 1997 to 2014 (Figure 7.1b). Rainfall deviation in 2030
from the average of 18 years was −95%, which considered scantly.
(a)
( b)
0
50
100
150
200
250
Rain fall (mm)
0
50
100
150
200
250
Rain fall (mm)
Fig. 7.1 Comparison between annual amounts of rain fall values from 1997 to 2014 and its projected value in 2030 in (a) North Sinai and (b) Marsa Matrouh. (Source: Ouda et al. 2016a)
7 Climate Change Assessment in Egypt: A Review
general circulation models project an increase in precipitation on the Blue Nile;
which contributes more than 75% of the Nile flows. Whereas, one-third expect
reduced precipitation. However, it is virtually certain that the Nile Basin has become
warmer and the warming is expected to continue.
Furthermore, Agrawala et al. (2004) indicated that vulnerability of Egypt’s water
resource and its dependence on the Nile is tied to trends in population growth, land
use, and agriculture intensively concentrated along the Nile Valley and Delta.
Alkitkat (2017) projected 32% increase in the Egyptian population by the year of
2030, compared to its value in 2014. Thus, it is likely that Nile water availability to
be increasingly stressed as demand increases, due to growth in population and
increases in temperature leading to greater evaporative losses.
It has also been suggested that Egypt’s precipitation may decrease due to climate
change, with an annual decline up to 5, 8 and 13% by 2030, 2050, and 2100, respectively (Barbi 2014). On the basis of rain fall deviations from the mean, four categories were developed by Kumar et al. (2009) to monitor and evaluate the rain fall
patterns: ±10% deviation consider as normal, −10 to −60% deviation in the rain fall
is consider as deficit, less than −60% deviation consider as scanty, and greater than
20% deviation consider as excess. Accordingly, Ouda et al. (2016a) the projected
value of annual rainfall in eastern coast of Egypt in 2030 was the lowest than its
counterpart values from 1997 to 2014, except for the amount of precipitation fall in
1999, which was lower (Figure 7.1a). Rainfall deviation in 2030 from the average
of 18 years was −27%, which considered deficit. Similarly, in the western coast of
Egypt, the projected annual rain fall value in 2030 will be the lowest compared to
the recorded values from 1997 to 2014 (Figure 7.1b). Rainfall deviation in 2030
from the average of 18 years was −95%, which considered scantly.
(a)
( b)
0
50
100
150
200
250
Rain fall (mm)
0
50
100
150
200
250
Rain fall (mm)
Fig. 7.1 Comparison between annual amounts of rain fall values from 1997 to 2014 and its projected value in 2030 in (a) North Sinai and (b) Marsa Matrouh. (Source: Ouda et al. 2016a)
7 Climate Change Assessment in Egypt: A Review