

shifted to the surroundings of I22, as a result of an inflow of the PCE contaminated
water from NE direction (I23 well). The original (t ¼ 8 days) concentration of ClE
was 27.7 mg/L, with a majority of DCE (Table 4.1).
Steel electrodes (four cathodes and one anode) were inserted into the aquifer to
the depth of the impermeable substrate (length 10 m) and the field was generated by
a 24 V AC/DC converter with a maximum output of 300 W. Eleven monitoring
boreholes were drilled to monitor the changes in the parameters (Fig. 4.7). This
arrangement makes it possible to study the pH and E h profiles between the cathodes
and anodes in different directions of groundwater flow, which will also have a
significant impact on these profiles.
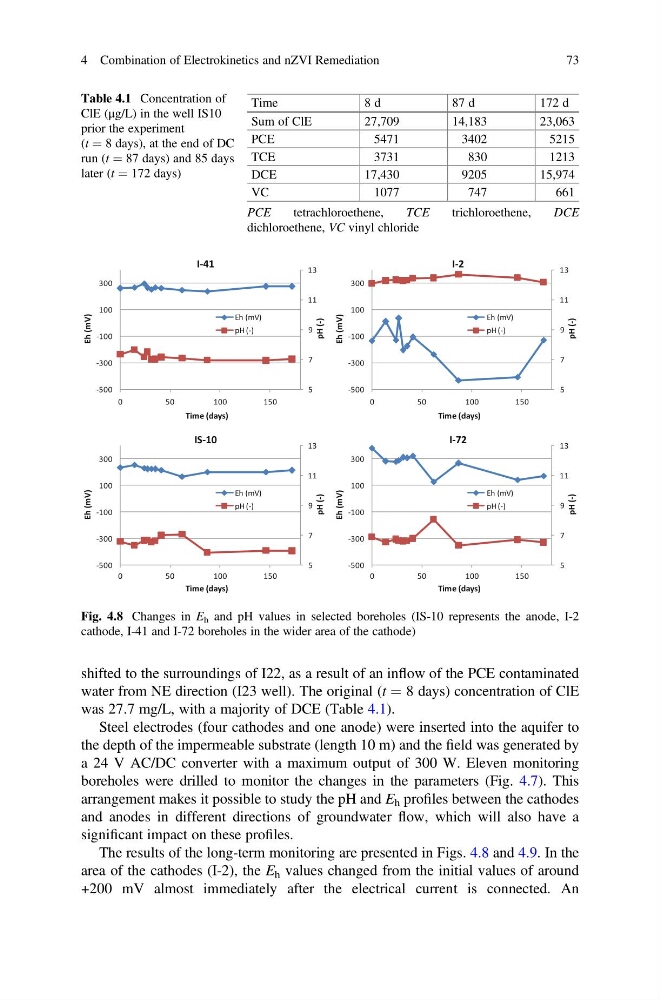
The results of the long-term monitoring are presented in Figs. 4.8 and 4.9. In the
area of the cathodes (I-2), the E h values changed from the initial values of around
+200 mV almost immediately after the electrical current is connected. An
Table 4.1 Concentration of
ClE (μg/L) in the well IS10
prior the experiment
(t ¼ 8 days), at the end of DC
run (t ¼ 87 days) and 85 days
later (t ¼ 172 days)
Time
8 d
87 d
172 d
Sum of ClE
27,709
14,183
23,063
PCE
5471
3402
5215
TCE
3731
830
1213
DCE
17,430
9205
15,974
VC
1077
747
661
PCE
tetrachloroethene,
TCE
trichloroethene,
DCE
dichloroethene, VC vinyl chloride
pH (-)
Eh (mV)
Time (days)
I-41
pH (-)
Eh (mV)
Time (days)
IS-10
pH (-)
Eh (mV)
Time (days)
I-2
pH (-)
Eh (mV)
Time (days)
I-72
Fig. 4.8 Changes in E h and pH values in selected boreholes (IS-10 represents the anode, I-2
cathode, I-41 and I-72 boreholes in the wider area of the cathode)
4 Combination of Electrokinetics and nZVI Remediation
73
water from NE direction (I23 well). The original (t ¼ 8 days) concentration of ClE
was 27.7 mg/L, with a majority of DCE (Table 4.1).
Steel electrodes (four cathodes and one anode) were inserted into the aquifer to
the depth of the impermeable substrate (length 10 m) and the field was generated by
a 24 V AC/DC converter with a maximum output of 300 W. Eleven monitoring
boreholes were drilled to monitor the changes in the parameters (Fig. 4.7). This
arrangement makes it possible to study the pH and E h profiles between the cathodes
and anodes in different directions of groundwater flow, which will also have a
significant impact on these profiles.
The results of the long-term monitoring are presented in Figs. 4.8 and 4.9. In the
area of the cathodes (I-2), the E h values changed from the initial values of around
+200 mV almost immediately after the electrical current is connected. An
Table 4.1 Concentration of
ClE (μg/L) in the well IS10
prior the experiment
(t ¼ 8 days), at the end of DC
run (t ¼ 87 days) and 85 days
later (t ¼ 172 days)
Time
8 d
87 d
172 d
Sum of ClE
27,709
14,183
23,063
PCE
5471
3402
5215
TCE
3731
830
1213
DCE
17,430
9205
15,974
VC
1077
747
661
PCE
tetrachloroethene,
TCE
trichloroethene,
DCE
dichloroethene, VC vinyl chloride
pH (-)
Eh (mV)
Time (days)
I-41
pH (-)
Eh (mV)
Time (days)
IS-10
pH (-)
Eh (mV)
Time (days)
I-2
pH (-)
Eh (mV)
Time (days)
I-72
Fig. 4.8 Changes in E h and pH values in selected boreholes (IS-10 represents the anode, I-2
cathode, I-41 and I-72 boreholes in the wider area of the cathode)
4 Combination of Electrokinetics and nZVI Remediation
73