

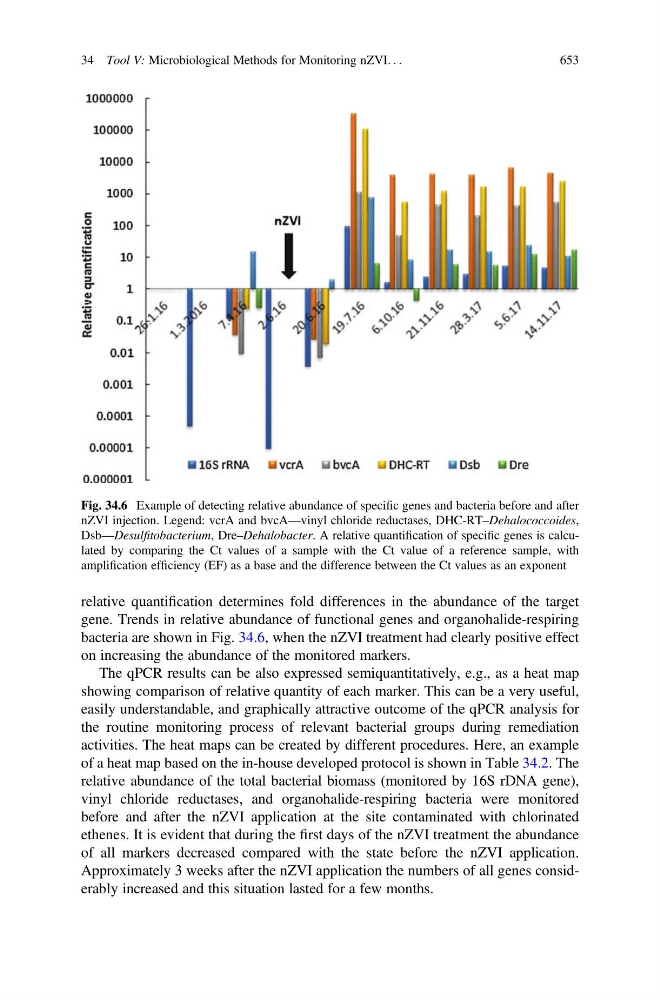
relative quantification determines fold differences in the abundance of the target
gene. Trends in relative abundance of functional genes and organohalide-respiring
bacteria are shown in Fig. 34.6, when the nZVI treatment had clearly positive effect
on increasing the abundance of the monitored markers.
The qPCR results can be also expressed semiquantitatively, e.g., as a heat map
showing comparison of relative quantity of each marker. This can be a very useful,
easily understandable, and graphically attractive outcome of the qPCR analysis for
the routine monitoring process of relevant bacterial groups during remediation
activities. The heat maps can be created by different procedures. Here, an example
of a heat map based on the in-house developed protocol is shown in Table 34.2. The
relative abundance of the total bacterial biomass (monitored by 16S rDNA gene),
vinyl chloride reductases, and organohalide-respiring bacteria were monitored
before and after the nZVI application at the site contaminated with chlorinated
ethenes. It is evident that during the first days of the nZVI treatment the abundance
of all markers decreased compared with the state before the nZVI application.
Approximately 3 weeks after the nZVI application the numbers of all genes considerably increased and this situation lasted for a few months.
Fig. 34.6 Example of detecting relative abundance of specific genes and bacteria before and after
nZVI injection. Legend: vcrA and bvcA—vinyl chloride reductases, DHC-RT–Dehalococcoides,
Dsb—Desulfitobacterium, Dre–Dehalobacter. A relative quantification of specific genes is calculated by comparing the Ct values of a sample with the Ct value of a reference sample, with
amplification efficiency (EF) as a base and the difference between the Ct values as an exponent
34 Tool V: Microbiological Methods for Monitoring nZVI. . .
653