

high COD concentrations, rising up to 45,500 mg L
À1 , in winery wastewaters and
the CW treating such wastewaters still provided great removal efficiency (RE),
up to 99%.
The quality of agro-industrial wastewaters varies during the year. Such variations
can be observed even here if we compare the inlet concentrations of all the parameters in the high season of 2013 (Table 18.2) and average of the off-seasons in years
Table 18.2 CW performance after 1 year of operation (September–November 2013) in high
production season
Parameter
CW filters
a
Stabilization ponds
b
C
in (mg/L)
C
out (mg/L)
RE (%)
C
out (mg/L)
RE
c (%)
COD
17,012 Æ 11,862
40 Æ 22
96.3 Æ 5
181 Æ 135
83.6 Æ 22.3
BOD 5
1806 Æ 1179
1 Æ 0.5
99.7 Æ 0.3
14 Æ 15
98.5 Æ 1.8
TSS
43,723 Æ 30,797
3 Æ 1
99.6 Æ 0.5
1047 Æ 1121
20.1 Æ 100
a CW filters (HF1-VF-HF2);
b
Stabilization ponds (SP1–SP3);
c Total value of RE after flowing
through SP
Table 18.3 Discharge limits set for the constructed wetland Chrámce
Parameter
Mean limit (mg/L)
Max limit (mg/L)
Removal limit (%)
COD
110
170
70–75%
BOD 5
30
50
80–85%
TSS
40
60
90–95%
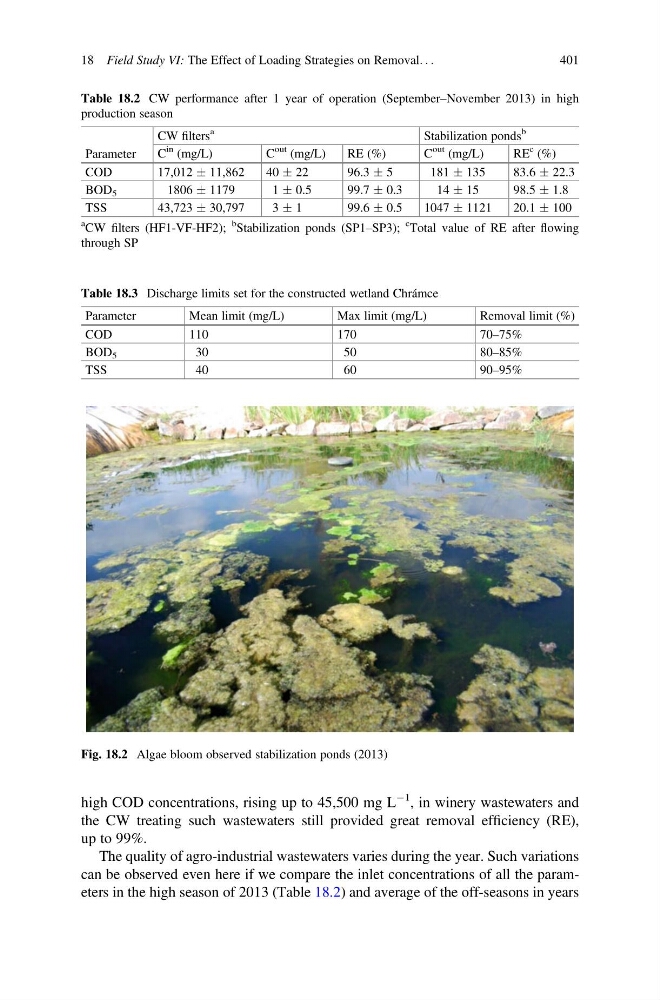
Fig. 18.2 Algae bloom observed stabilization ponds (2013)
18 Field Study VI: The Effect of Loading Strategies on Removal. . .
401
À1 , in winery wastewaters and
the CW treating such wastewaters still provided great removal efficiency (RE),
up to 99%.
The quality of agro-industrial wastewaters varies during the year. Such variations
can be observed even here if we compare the inlet concentrations of all the parameters in the high season of 2013 (Table 18.2) and average of the off-seasons in years
Table 18.2 CW performance after 1 year of operation (September–November 2013) in high
production season
Parameter
CW filters
a
Stabilization ponds
b
C
in (mg/L)
C
out (mg/L)
RE (%)
C
out (mg/L)
RE
c (%)
COD
17,012 Æ 11,862
40 Æ 22
96.3 Æ 5
181 Æ 135
83.6 Æ 22.3
BOD 5
1806 Æ 1179
1 Æ 0.5
99.7 Æ 0.3
14 Æ 15
98.5 Æ 1.8
TSS
43,723 Æ 30,797
3 Æ 1
99.6 Æ 0.5
1047 Æ 1121
20.1 Æ 100
a CW filters (HF1-VF-HF2);
b
Stabilization ponds (SP1–SP3);
c Total value of RE after flowing
through SP
Table 18.3 Discharge limits set for the constructed wetland Chrámce
Parameter
Mean limit (mg/L)
Max limit (mg/L)
Removal limit (%)
COD
110
170
70–75%
BOD 5
30
50
80–85%
TSS
40
60
90–95%
Fig. 18.2 Algae bloom observed stabilization ponds (2013)
18 Field Study VI: The Effect of Loading Strategies on Removal. . .
401