

all the operations were based on the findings revealed during the laboratory tests.
Raw groundwater pumped into the container was turbid, strongly smelling of
organic solvents, and had a gray color. After the first step, i.e., an application of
commercial ferrates, color of the raw water rapidly changed to pale orange (within a
few minutes) as a consequence of Fe
3+ ions formation from ferrates reduction.
Moreover, this process was associated with the ferric sludge formation (hydrated
forms of Fe-oxides) in the form of flakes, which removed the water turbidity and
supported sedimentation. After the second step, i.e., hydrogen peroxide application,
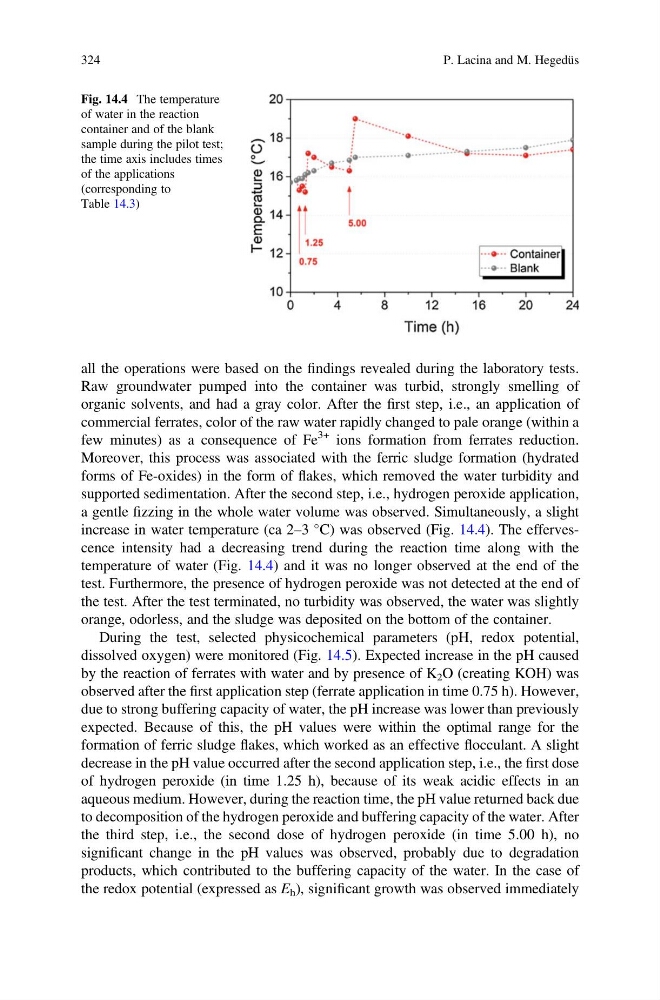
a gentle fizzing in the whole water volume was observed. Simultaneously, a slight
increase in water temperature (ca 2–3
C) was observed (Fig. 14.4). The effervescence intensity had a decreasing trend during the reaction time along with the
temperature of water (Fig. 14.4) and it was no longer observed at the end of the
test. Furthermore, the presence of hydrogen peroxide was not detected at the end of
the test. After the test terminated, no turbidity was observed, the water was slightly
orange, odorless, and the sludge was deposited on the bottom of the container.
During the test, selected physicochemical parameters (pH, redox potential,
dissolved oxygen) were monitored (Fig. 14.5). Expected increase in the pH caused
by the reaction of ferrates with water and by presence of K 2 O (creating KOH) was
observed after the first application step (ferrate application in time 0.75 h). However,
due to strong buffering capacity of water, the pH increase was lower than previously
expected. Because of this, the pH values were within the optimal range for the
formation of ferric sludge flakes, which worked as an effective flocculant. A slight
decrease in the pH value occurred after the second application step, i.e., the first dose
of hydrogen peroxide (in time 1.25 h), because of its weak acidic effects in an
aqueous medium. However, during the reaction time, the pH value returned back due
to decomposition of the hydrogen peroxide and buffering capacity of the water. After
the third step, i.e., the second dose of hydrogen peroxide (in time 5.00 h), no
significant change in the pH values was observed, probably due to degradation
products, which contributed to the buffering capacity of the water. In the case of
the redox potential (expressed as E h ), significant growth was observed immediately
Fig. 14.4 The temperature
of water in the reaction
container and of the blank
sample during the pilot test;
the time axis includes times
of the applications
(corresponding to
Table 14.3)
324
P. Lacina and M. Hegedüs
Raw groundwater pumped into the container was turbid, strongly smelling of
organic solvents, and had a gray color. After the first step, i.e., an application of
commercial ferrates, color of the raw water rapidly changed to pale orange (within a
few minutes) as a consequence of Fe
3+ ions formation from ferrates reduction.
Moreover, this process was associated with the ferric sludge formation (hydrated
forms of Fe-oxides) in the form of flakes, which removed the water turbidity and
supported sedimentation. After the second step, i.e., hydrogen peroxide application,
a gentle fizzing in the whole water volume was observed. Simultaneously, a slight
increase in water temperature (ca 2–3
C) was observed (Fig. 14.4). The effervescence intensity had a decreasing trend during the reaction time along with the
temperature of water (Fig. 14.4) and it was no longer observed at the end of the
test. Furthermore, the presence of hydrogen peroxide was not detected at the end of
the test. After the test terminated, no turbidity was observed, the water was slightly
orange, odorless, and the sludge was deposited on the bottom of the container.
During the test, selected physicochemical parameters (pH, redox potential,
dissolved oxygen) were monitored (Fig. 14.5). Expected increase in the pH caused
by the reaction of ferrates with water and by presence of K 2 O (creating KOH) was
observed after the first application step (ferrate application in time 0.75 h). However,
due to strong buffering capacity of water, the pH increase was lower than previously
expected. Because of this, the pH values were within the optimal range for the
formation of ferric sludge flakes, which worked as an effective flocculant. A slight
decrease in the pH value occurred after the second application step, i.e., the first dose
of hydrogen peroxide (in time 1.25 h), because of its weak acidic effects in an
aqueous medium. However, during the reaction time, the pH value returned back due
to decomposition of the hydrogen peroxide and buffering capacity of the water. After
the third step, i.e., the second dose of hydrogen peroxide (in time 5.00 h), no
significant change in the pH values was observed, probably due to degradation
products, which contributed to the buffering capacity of the water. In the case of
the redox potential (expressed as E h ), significant growth was observed immediately
Fig. 14.4 The temperature
of water in the reaction
container and of the blank
sample during the pilot test;
the time axis includes times
of the applications
(corresponding to
Table 14.3)
324
P. Lacina and M. Hegedüs