

pump situated in the influent channel, hose, artificial channel where the ferrate(VI) was
dosed, and the exit hose that goes back to the main wastewater flow channel.
Ferrate(VI) production time was 30 min per each preparation. The resulting
ferrate(VI) was measured using an established spectroscopy method where the
absorbance of the ferrate(VI) solution was measured at 505 nm. The absorbance
was converted to the concentration using an absorption coefficient of 1100
1/(M cm). The ferrate(VI) dosing flow rate was determined based on the desired
dose and the measured ferrate(VI) concentration. The samples after ferrate
(VI) dosing and mixing were collected and analyzed for the concentrations of
suspended solids (SS), chemical oxygen demand (COD), biochemical oxygen
demand (BOD), total phosphorus (P), pH, and residual Fe.
12.3 Results and Discussion
12.3.1 Pilot-Scale Drinking Water Treatment Performance
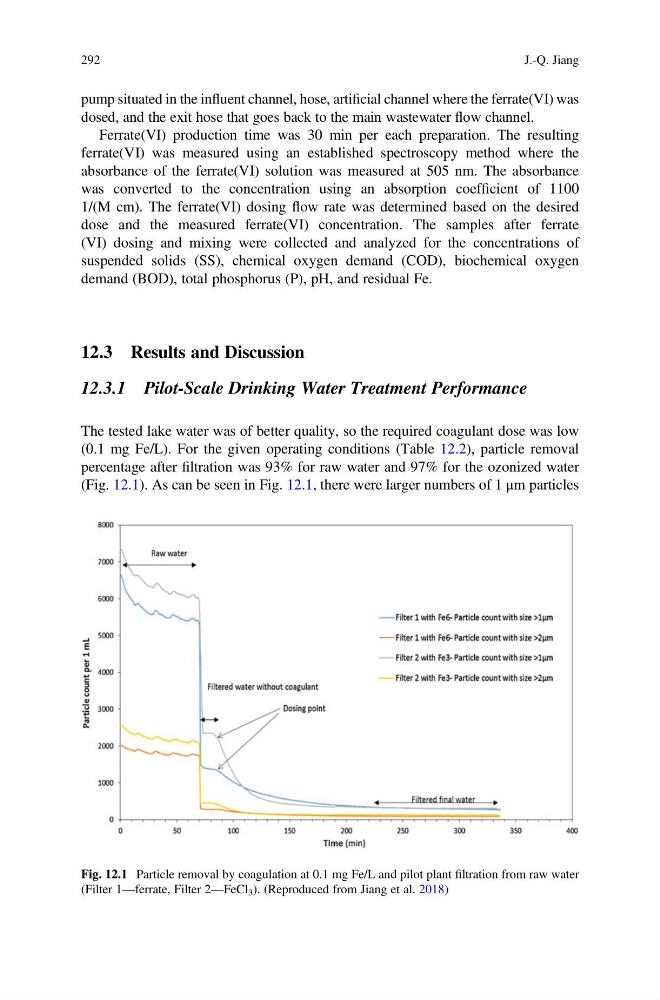
The tested lake water was of better quality, so the required coagulant dose was low
(0.1 mg Fe/L). For the given operating conditions (Table 12.2), particle removal
percentage after filtration was 93% for raw water and 97% for the ozonized water
(Fig. 12.1). As can be seen in Fig. 12.1, there were larger numbers of 1 μm particles
Fig. 12.1 Particle removal by coagulation at 0.1 mg Fe/L and pilot plant filtration from raw water
(Filter 1—ferrate, Filter 2—FeCl 3 ). (Reproduced from Jiang et al. 2018)
292
J.-Q. Jiang
dosed, and the exit hose that goes back to the main wastewater flow channel.
Ferrate(VI) production time was 30 min per each preparation. The resulting
ferrate(VI) was measured using an established spectroscopy method where the
absorbance of the ferrate(VI) solution was measured at 505 nm. The absorbance
was converted to the concentration using an absorption coefficient of 1100
1/(M cm). The ferrate(VI) dosing flow rate was determined based on the desired
dose and the measured ferrate(VI) concentration. The samples after ferrate
(VI) dosing and mixing were collected and analyzed for the concentrations of
suspended solids (SS), chemical oxygen demand (COD), biochemical oxygen
demand (BOD), total phosphorus (P), pH, and residual Fe.
12.3 Results and Discussion
12.3.1 Pilot-Scale Drinking Water Treatment Performance
The tested lake water was of better quality, so the required coagulant dose was low
(0.1 mg Fe/L). For the given operating conditions (Table 12.2), particle removal
percentage after filtration was 93% for raw water and 97% for the ozonized water
(Fig. 12.1). As can be seen in Fig. 12.1, there were larger numbers of 1 μm particles
Fig. 12.1 Particle removal by coagulation at 0.1 mg Fe/L and pilot plant filtration from raw water
(Filter 1—ferrate, Filter 2—FeCl 3 ). (Reproduced from Jiang et al. 2018)
292
J.-Q. Jiang