

strongest fall in DCE was observed in the most contaminated boreholes AW5–57
and AW5–58.
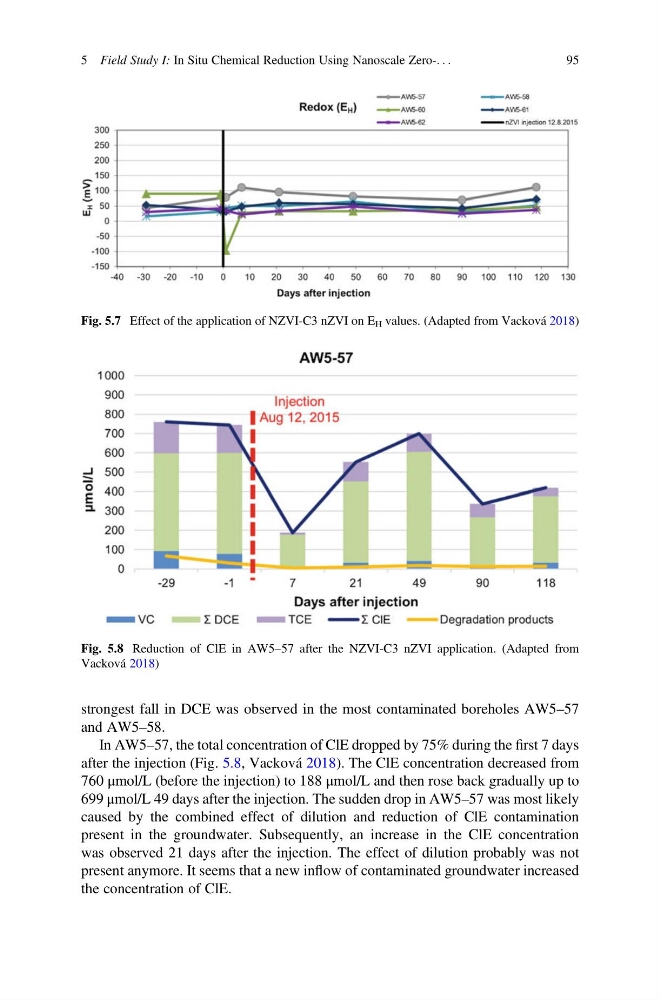
In AW5–57, the total concentration of ClE dropped by 75% during the first 7 days
after the injection (Fig. 5.8, Vacková 2018). The ClE concentration decreased from
760 μmol/L (before the injection) to 188 μmol/L and then rose back gradually up to
699 μmol/L 49 days after the injection. The sudden drop in AW5–57 was most likely
caused by the combined effect of dilution and reduction of ClE contamination
present in the groundwater. Subsequently, an increase in the ClE concentration
was observed 21 days after the injection. The effect of dilution probably was not
present anymore. It seems that a new inflow of contaminated groundwater increased
the concentration of ClE.
Fig. 5.7 Effect of the application of NZVI-C3 nZVI on E H values. (Adapted from Vacková 2018)
Fig. 5.8 Reduction of ClE in AW5–57 after the NZVI-C3 nZVI application. (Adapted from
Vacková 2018)
5 Field Study I: In Situ Chemical Reduction Using Nanoscale Zero-. . .
95
and AW5–58.
In AW5–57, the total concentration of ClE dropped by 75% during the first 7 days
after the injection (Fig. 5.8, Vacková 2018). The ClE concentration decreased from
760 μmol/L (before the injection) to 188 μmol/L and then rose back gradually up to
699 μmol/L 49 days after the injection. The sudden drop in AW5–57 was most likely
caused by the combined effect of dilution and reduction of ClE contamination
present in the groundwater. Subsequently, an increase in the ClE concentration
was observed 21 days after the injection. The effect of dilution probably was not
present anymore. It seems that a new inflow of contaminated groundwater increased
the concentration of ClE.
Fig. 5.7 Effect of the application of NZVI-C3 nZVI on E H values. (Adapted from Vacková 2018)
Fig. 5.8 Reduction of ClE in AW5–57 after the NZVI-C3 nZVI application. (Adapted from
Vacková 2018)
5 Field Study I: In Situ Chemical Reduction Using Nanoscale Zero-. . .
95