

5.3 Results
5.3.1 NANOFER Star
Figure 5.3 illustrates the effect of the first application. The reduction potential
dropped in boreholes AW5–57, AW5–58, AW5–60, AW5–61, and AW5–62 immediately after the injection. The strongest decrease was recorded in AW5–58 (E H
decreased from 110 mV to À370 mV). The values of E H started to increase and they
rose for 30 days of the injection. Approximately after 30 days, the redox conditions
in the groundwater remained constant (Vacková 2018).
The major contaminants in the pilot test area were TCE, DCE, and VC. There was
an imperceptible concentration of tetrachloroethene registered; therefore, it was not
plotted on the graphs below. To determine the reduction of chlorinated ethenes
(ClE), products of degradation (ethane and ethene) were investigated. Contaminants
as well as products of degradation are plotted together on Figs. 5.4–5.6. For better
understanding and comparison, the graphs were created in the same scale (maximum
value 1400 μmol/L).
The NANOFER STAR application caused a sudden decrease in the contaminant
concentrations. Figure 5.4 (Vacková 2018) represents the sharpest decrease of 98%,
which was detected in the borehole AW5–57 7 days after the nZVI application. The
total concentration of ClE went down from 1294 μmol/L to 20.5 μmol/L. This
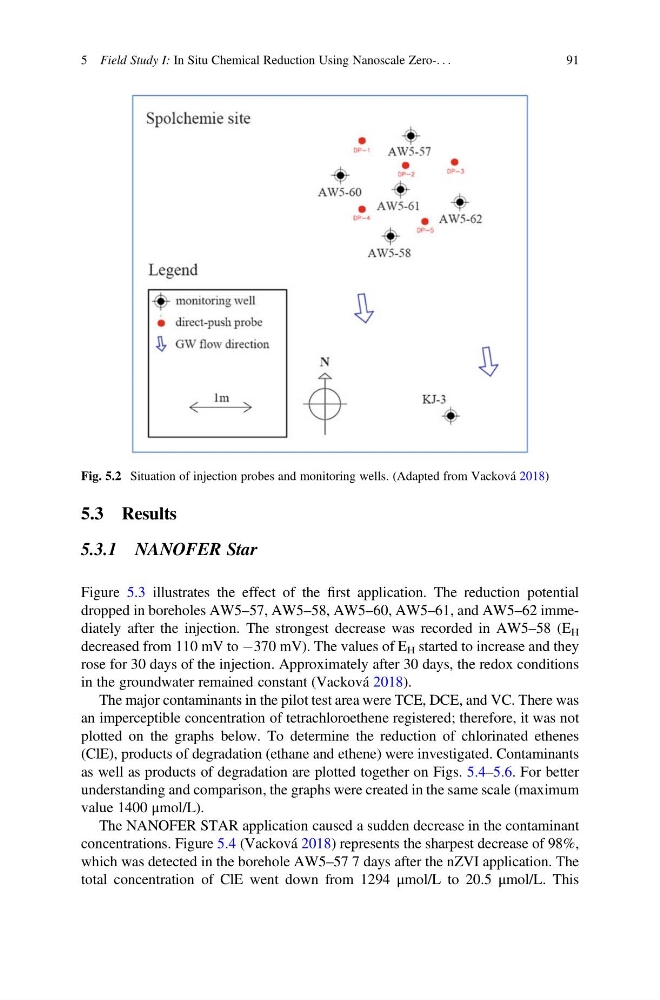
Fig. 5.2 Situation of injection probes and monitoring wells. (Adapted from Vacková 2018)
5 Field Study I: In Situ Chemical Reduction Using Nanoscale Zero-. . .
91
5.3.1 NANOFER Star
Figure 5.3 illustrates the effect of the first application. The reduction potential
dropped in boreholes AW5–57, AW5–58, AW5–60, AW5–61, and AW5–62 immediately after the injection. The strongest decrease was recorded in AW5–58 (E H
decreased from 110 mV to À370 mV). The values of E H started to increase and they
rose for 30 days of the injection. Approximately after 30 days, the redox conditions
in the groundwater remained constant (Vacková 2018).
The major contaminants in the pilot test area were TCE, DCE, and VC. There was
an imperceptible concentration of tetrachloroethene registered; therefore, it was not
plotted on the graphs below. To determine the reduction of chlorinated ethenes
(ClE), products of degradation (ethane and ethene) were investigated. Contaminants
as well as products of degradation are plotted together on Figs. 5.4–5.6. For better
understanding and comparison, the graphs were created in the same scale (maximum
value 1400 μmol/L).
The NANOFER STAR application caused a sudden decrease in the contaminant
concentrations. Figure 5.4 (Vacková 2018) represents the sharpest decrease of 98%,
which was detected in the borehole AW5–57 7 days after the nZVI application. The
total concentration of ClE went down from 1294 μmol/L to 20.5 μmol/L. This
Fig. 5.2 Situation of injection probes and monitoring wells. (Adapted from Vacková 2018)
5 Field Study I: In Situ Chemical Reduction Using Nanoscale Zero-. . .
91