

a certain temperature range, up to around 600
C. The device is technically designed
to detect three peaks during the heating period which are denoted by S1, S2 and S3.
The peaks S1 and S2 are detected by an FID (flame ionization detector, see Sect.
4.1.1), that allows to trace released hydrocarbons and further organic substances.
The last peak (S3) is an IR detector (similar to the TOC approach) that analyzes CO 2 .
This CO 2 is trapped during the pyrolysis process and deliberated after the heating
period for further measurement.
The size of the first peak is proportional to the amount of native bitumen or
thermodesorbable compounds. Peak S2 is proportional to the quantity of liquid
products, which are produced in the pyrolysis of kerogen, representing the macromolecular part of the total organic matter. Finally, S3 represents amount of CO 2
released in the pyrolysis process and characterizes the organically bound oxygen as
an indicator for functional groups in the organic material.
The resulting S1, S2 and S3 values are used to calculate specific parameters such
as HI (hydrogen index) and OI (oxygen index) indices, that allow a classification of
the kerogen type. Further on, the temperature at the maximum in peak S2 is named
T max and is used as indicator for the thermal maturity of the material.
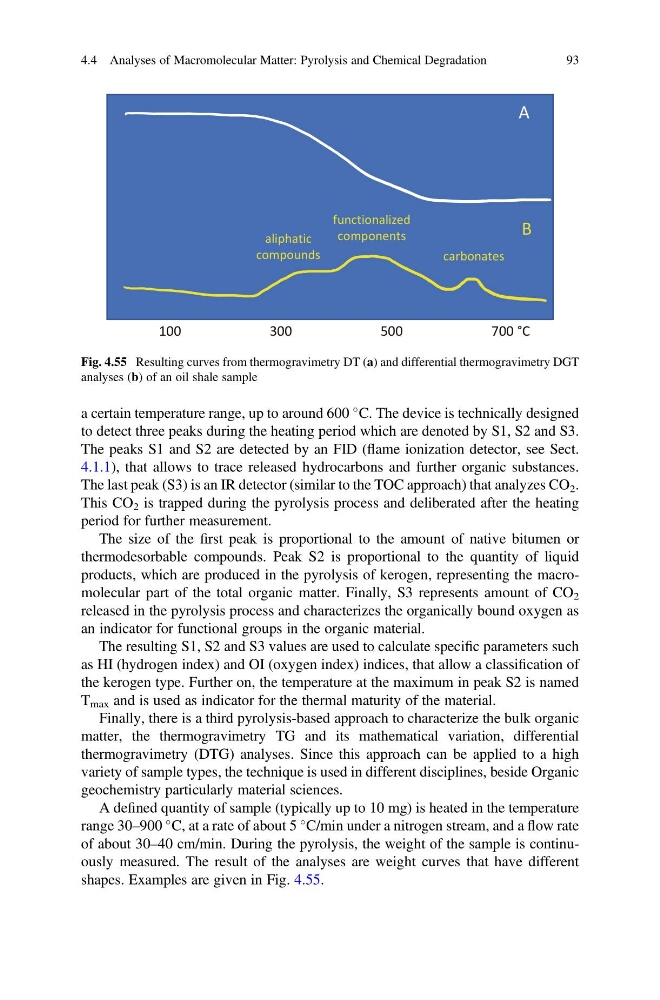
Finally, there is a third pyrolysis-based approach to characterize the bulk organic
matter, the thermogravimetry TG and its mathematical variation, differential
thermogravimetry (DTG) analyses. Since this approach can be applied to a high
variety of sample types, the technique is used in different disciplines, beside Organic
geochemistry particularly material sciences.
A defined quantity of sample (typically up to 10 mg) is heated in the temperature
range 30–900
C, at a rate of about 5
C/min under a nitrogen stream, and a flow rate
of about 30–40 cm/min. During the pyrolysis, the weight of the sample is continuously measured. The result of the analyses are weight curves that have different
shapes. Examples are given in Fig. 4.55.
carbonates
aliphatic
compounds
functionalized
components
100
300
500
700 °C
A
B
Fig. 4.55 Resulting curves from thermogravimetry DT (a) and differential thermogravimetry DGT
analyses (b) of an oil shale sample
4.4 Analyses of Macromolecular Matter: Pyrolysis and Chemical Degradation
93
C. The device is technically designed
to detect three peaks during the heating period which are denoted by S1, S2 and S3.
The peaks S1 and S2 are detected by an FID (flame ionization detector, see Sect.
4.1.1), that allows to trace released hydrocarbons and further organic substances.
The last peak (S3) is an IR detector (similar to the TOC approach) that analyzes CO 2 .
This CO 2 is trapped during the pyrolysis process and deliberated after the heating
period for further measurement.
The size of the first peak is proportional to the amount of native bitumen or
thermodesorbable compounds. Peak S2 is proportional to the quantity of liquid
products, which are produced in the pyrolysis of kerogen, representing the macromolecular part of the total organic matter. Finally, S3 represents amount of CO 2
released in the pyrolysis process and characterizes the organically bound oxygen as
an indicator for functional groups in the organic material.
The resulting S1, S2 and S3 values are used to calculate specific parameters such
as HI (hydrogen index) and OI (oxygen index) indices, that allow a classification of
the kerogen type. Further on, the temperature at the maximum in peak S2 is named
T max and is used as indicator for the thermal maturity of the material.
Finally, there is a third pyrolysis-based approach to characterize the bulk organic
matter, the thermogravimetry TG and its mathematical variation, differential
thermogravimetry (DTG) analyses. Since this approach can be applied to a high
variety of sample types, the technique is used in different disciplines, beside Organic
geochemistry particularly material sciences.
A defined quantity of sample (typically up to 10 mg) is heated in the temperature
range 30–900
C, at a rate of about 5
C/min under a nitrogen stream, and a flow rate
of about 30–40 cm/min. During the pyrolysis, the weight of the sample is continuously measured. The result of the analyses are weight curves that have different
shapes. Examples are given in Fig. 4.55.
carbonates
aliphatic
compounds
functionalized
components
100
300
500
700 °C
A
B
Fig. 4.55 Resulting curves from thermogravimetry DT (a) and differential thermogravimetry DGT
analyses (b) of an oil shale sample
4.4 Analyses of Macromolecular Matter: Pyrolysis and Chemical Degradation
93