

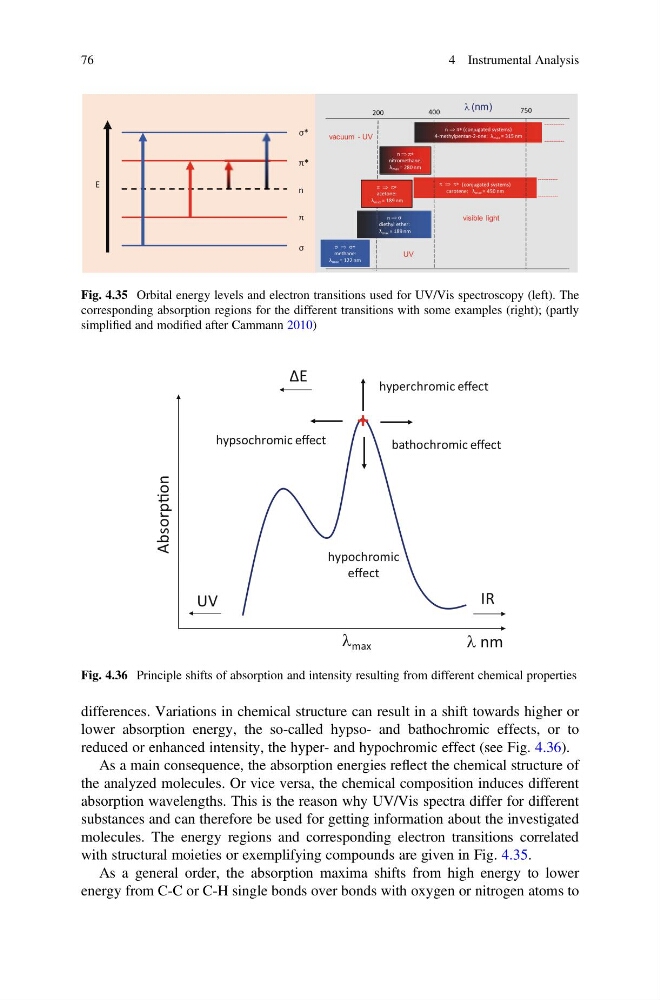
differences. Variations in chemical structure can result in a shift towards higher or
lower absorption energy, the so-called hypso- and bathochromic effects, or to
reduced or enhanced intensity, the hyper- and hypochromic effect (see Fig. 4.36).
As a main consequence, the absorption energies reflect the chemical structure of
the analyzed molecules. Or vice versa, the chemical composition induces different
absorption wavelengths. This is the reason why UV/Vis spectra differ for different
substances and can therefore be used for getting information about the investigated
molecules. The energy regions and corresponding electron transitions correlated
with structural moieties or exemplifying compounds are given in Fig. 4.35.
As a general order, the absorption maxima shifts from high energy to lower
energy from C-C or C-H single bonds over bonds with oxygen or nitrogen atoms to
σ*
π*
π
σ
n
E
methane:
λmax = 122 nm
n
nitromethane:
λmax = 280 nm
n
(conjugated systems)
4-methylpentan-2-one: λmax = 315 nm
(conjugated systems)
carotene: λmax = 450 nm
200
400
750
vacuum - UV
(nm)
n
diethyl ether:
λmax = 189 nm
acetone:
λmax = 189 nm
UV
visible light
Fig. 4.35 Orbital energy levels and electron transitions used for UV/Vis spectroscopy (left). The
corresponding absorption regions for the different transitions with some examples (right); (partly
simplified and modified after Cammann 2010)
bathochromic effect
hyperchromic effect
hypsochromic effect
IR
UV
ΔE
AbsorpƟon
λ nm
λ max
hypochromic
effect
+
Fig. 4.36 Principle shifts of absorption and intensity resulting from different chemical properties
76
4 Instrumental Analysis
lower absorption energy, the so-called hypso- and bathochromic effects, or to
reduced or enhanced intensity, the hyper- and hypochromic effect (see Fig. 4.36).
As a main consequence, the absorption energies reflect the chemical structure of
the analyzed molecules. Or vice versa, the chemical composition induces different
absorption wavelengths. This is the reason why UV/Vis spectra differ for different
substances and can therefore be used for getting information about the investigated
molecules. The energy regions and corresponding electron transitions correlated
with structural moieties or exemplifying compounds are given in Fig. 4.35.
As a general order, the absorption maxima shifts from high energy to lower
energy from C-C or C-H single bonds over bonds with oxygen or nitrogen atoms to
σ*
π*
π
σ
n
E
methane:
λmax = 122 nm
n
nitromethane:
λmax = 280 nm
n
(conjugated systems)
4-methylpentan-2-one: λmax = 315 nm
(conjugated systems)
carotene: λmax = 450 nm
200
400
750
vacuum - UV
(nm)
n
diethyl ether:
λmax = 189 nm
acetone:
λmax = 189 nm
UV
visible light
Fig. 4.35 Orbital energy levels and electron transitions used for UV/Vis spectroscopy (left). The
corresponding absorption regions for the different transitions with some examples (right); (partly
simplified and modified after Cammann 2010)
bathochromic effect
hyperchromic effect
hypsochromic effect
IR
UV
ΔE
AbsorpƟon
λ nm
λ max
hypochromic
effect
+
Fig. 4.36 Principle shifts of absorption and intensity resulting from different chemical properties
76
4 Instrumental Analysis