

same fraction or the same extract. If the second precondition cannot be fulfilled, a
correction via a surrogate standard is possible (see Chap. 6).
However, many biomarker parameters consist of chemically similar compounds
with similar mass spectrometric properties appearing in the same fraction. Examples
include the TAR or CPI parameter derived from n-alkanes, the pristane/phytane ratio
as well as hopane ratios calculated from the m/z 191 ion chromatograms (for more
information on biomarker analyses see Volume 1 and 2 of Fundamentals in Organic
Geochemistry).
Case Example: How to calculate a biomarker ratio
Biomarker ratios are usually easily calculated. Base of the simple approach is
the comparison of chemically highly similar substances exhibiting also very
similar mass spectrometric properties. As an example, hopane ratios are
commonly calculated from a specific ion chromatogram, the m/z 191 trace.
An example is given in the following:
(continued)
Analyte
Added
standard
Sample with
unknown concentraƟon
of the target analyte
Standard with
known concentraƟon
of the target analyte
y : signal
c: concentraƟon
index A: analyte
index S: added analyte
l
a
n
g
i
s
retenƟon Ɵme
+
=
+
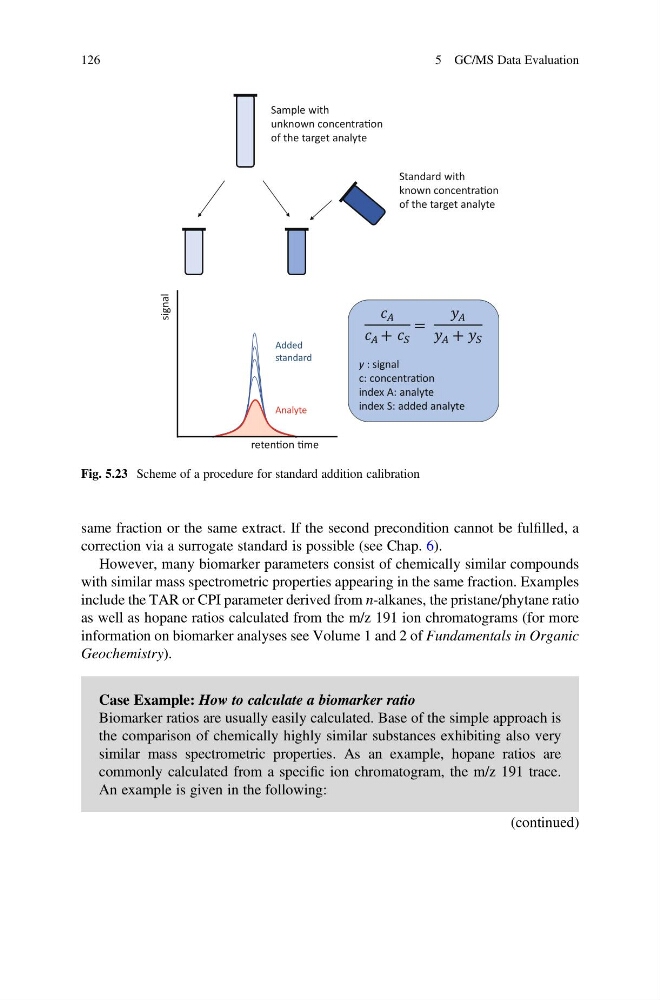
Fig. 5.23 Scheme of a procedure for standard addition calibration
126
5 GC/MS Data Evaluation
correction via a surrogate standard is possible (see Chap. 6).
However, many biomarker parameters consist of chemically similar compounds
with similar mass spectrometric properties appearing in the same fraction. Examples
include the TAR or CPI parameter derived from n-alkanes, the pristane/phytane ratio
as well as hopane ratios calculated from the m/z 191 ion chromatograms (for more
information on biomarker analyses see Volume 1 and 2 of Fundamentals in Organic
Geochemistry).
Case Example: How to calculate a biomarker ratio
Biomarker ratios are usually easily calculated. Base of the simple approach is
the comparison of chemically highly similar substances exhibiting also very
similar mass spectrometric properties. As an example, hopane ratios are
commonly calculated from a specific ion chromatogram, the m/z 191 trace.
An example is given in the following:
(continued)
Analyte
Added
standard
Sample with
unknown concentraƟon
of the target analyte
Standard with
known concentraƟon
of the target analyte
y : signal
c: concentraƟon
index A: analyte
index S: added analyte
l
a
n
g
i
s
retenƟon Ɵme
+
=
+
Fig. 5.23 Scheme of a procedure for standard addition calibration
126
5 GC/MS Data Evaluation